CKBlog: The Market
Friday, January 25, 2019
2018 Market Review
by The CastleKeep Team
Heading into 2018, the S&P 500 Index had delivered nearly 10 years of positive returns. In our 2017 review letter, we noted the previous 12 months were among the least volatile in history. While 2017 equity markets experienced much less volatility than most investors were accustomed to, many analysts expected more volatility in 2018—these expectations were confirmed in earnest after the September highs. In fact, 2018 reminded investors that equity markets are unpredictable and volatile. As they should be. Otherwise, why should we expect 8-10% returns per year over the long run?
In this letter, we will:
- Discuss why 2018 was painful for many.
- Demonstrate there was nowhere to hide.
- Reiterate our conviction for diversification into non-US stocks despite their recent lag.
- Highlight reasons to remain positive.
- Thank you for our fastest growth in clients in more than a decade.
But first, a note about the Contrast Principle from renowned psychologist Robert Caldini’s book Influence: the Psychology of Persuasion:
“There is a principle in human perception, the Contrast Principle, which affects the way we see the difference between two things that are presented one after the other.
“Each student takes a turn sitting in front of three pails of water—one cold, one at room temperature, and one hot. After placing one hand in the cold water and one in the hot water, the student is told to place both hands in the lukewarm water simultaneously. The look of amusement and bewilderment that immediately registers tells the story:
“Even though both hands are in the same bucket, the hand that has been in the cold water feels as if it is now in hot water, while the one that was in the hot water feels as if it is now in cold water ... in this instance, room temperature water can seem very different, depending on the nature of the event that precedes it.” [Harper Collins, 2007 Edition]
The fourth quarter volatility felt more volatile as it was drastically different from the previous years’ action. As Caldini explains, “if the second item is fairly different from the first, we will tend to see it as more different than it actually is.” [Harper Collins, 2007 Edition] Late 2018 was difficult. Even more so because investors had been conditioned for steady gains over the last several years. If you were nervous, you can rest assured that you were not alone.
Let’s apply Caldini’s principle to the markets. Below is the S&P 500 Index total return by year since 2012 versus the number of days during each year where the index closed down more than 2%:
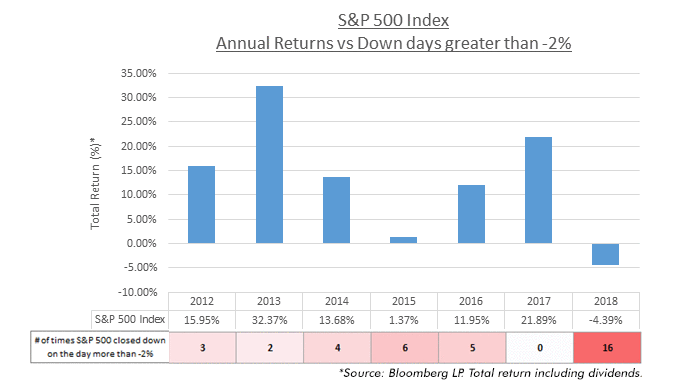
As you can see above, most investors were not only conditioned to expect the positive trend would continue, but they grew accustomed to a smooth ride along the way. It was like taking the monorail to Disney World and being dropped off at the Space Mountain ride.
Nowhere to Hide
As if the fourth quarter volatility wasn’t enough, there was nowhere to hide in 2018. It was a down year for nearly every major asset class across the globe:
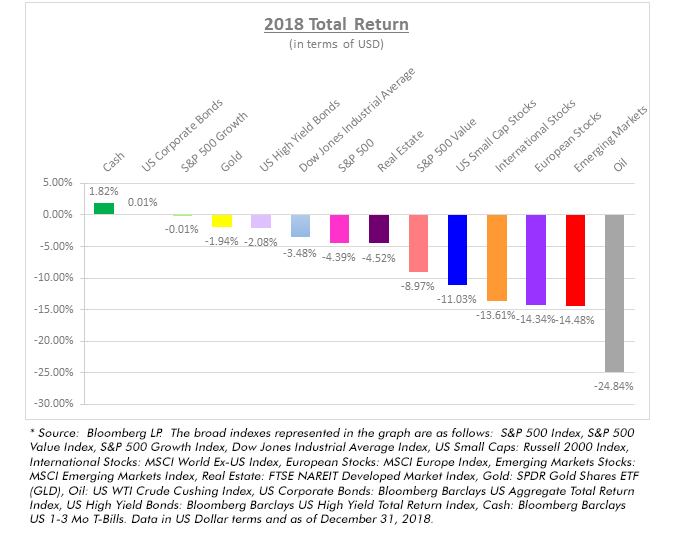
That’s right. The two major asset classes in the world that did not suffer losses in 2018 were US Dollar cash and US Corporate Bonds (which sported a pre-tax total return of a whopping +0.01%). There was nowhere to hide. Cash was king in 2018.
Why?
It’s impossible to exactly pinpoint what caused each of the indexes above to sell-off as they each have their own dynamics. But the following is true:
- Global equity markets have been generally bullish since the financial crisis. As of the US equity market bottom beginning in March 2009, the S&P 500 Index is up more than +355%, and the MSCI World Index is up more than +255% (cumulative returns). Even bonds have performed well with the Barclays US Aggregate Total Return Bond Index delivering over +42% for the same period. But, as we experienced recently, nothing lasts forever.
- Interest Rates in the developed markets have increased in line with expected (or hoped for) inflation. When interest rates go up, bond prices go down (all else being equal). But higher rates also result in competition for equity investment capital. The US Government 10-Year yield was 2.68% on December 31, 2018—very tempting for certain risk-averse investors. We have noted that cash allocations added to performance in 2018 for the first time in a while.
- Tariff and trade disputes have increased the possibility of recession and thus uncertainty for multinational corporations. The apparent slowdown in the Chinese economy as well as possible recession in Germany and new government in Italy all have contributed to the unease.
- General view that the global economy is slowing despite US Fed Chairman Powell signaling rate increases should continue in 2019 to help temper US growth.
- BREXIT negotiations are reaching a tipping point. In early December, Prime Minister Theresa May was forced into a “no confidence” vote. While she narrowly passed with “confidence”, it signaled weakness for her BREXIT agenda. Like Downton Abbey, this saga continues ...
- US House of Representatives flipped to the Democrats’ control in November 2018. While some political pundits believe this means Trump’s “pro-business” agenda is in peril, having a divided Congress isn’t always bad. It generally means no major policy changes will be enacted into law. By and large, markets tend to be satisfied with neutral legislative results.
Growth to Value?
Within the US equity markets, growth oriented stocks dominated through the first three quarters of 2018. The S&P 500 Growth index was up +17.24% through the end of September buoyed by the likes of Amazon, Apple, and Netflix. Then the index sold-off by -14.71% in the fourth quarter. It is not surprising that during volatility high-price to earnings stocks would get hit the most. But as we’ve written about before, there may be other catalysts at play. See Value With Growth
So has the shift back to value stocks finally started? Evidence suggests it might. The S&P 500 Value index outperformed its growth counterpart by more than 260 basis points in the fourth quarter. If this shift represents an inflection point, we will welcome it with open arms since our investment philosophy generally tilts towards value (and we have been waiting patiently).
Looking Abroad
Client portfolios have also held a significant exposure to non-US stocks. Our conviction has strengthened by lower valuations overseas and charts like the one on the following page (courtesy of JP Morgan Asset Management). The gray line plots the US stock market (S&P 500 index) while the purple line plots the non-US stock markets (ACWI ex-US index):
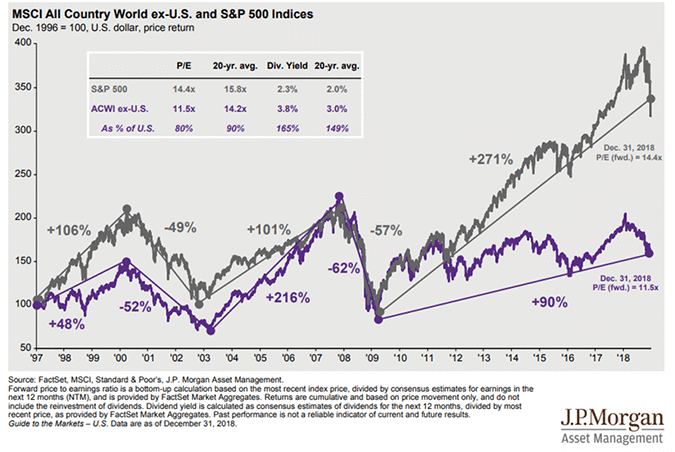
The delta between US and non-US valuations measured by price returns and price-to-earnings ratios is stark. We expect the lines to converge. Our view isn’t new—we’ve been writing about non-US stocks for some time: See Don’t Sleep on Non-US Stocks
The Good News (Wait ... there’s good news?!)
When stocks sell off, they become cheaper and therefore more attractive. When shopping for most goods, consumers are enticed to buy more when prices go down. If there was suddenly a flash sale on iPhones offering a 20% discount, might you upgrade your phone? It seems like the opposite occurs for mom and pop investors when stocks go “on sale” because fear kicks in. US stock prices dropped by 20% in many sectors in 2018, but most investors ran for the exits.
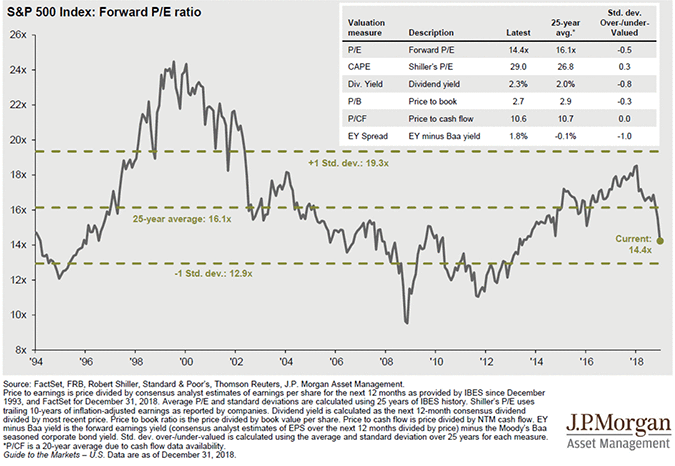
However, consider this—as of December 31st, the price-to-expected-forward-earnings (forward P/E) ratio of the S&P 500 Index stood at 14.4 times. This is the cheapest US stocks have been during the last five years. If you check out the graph below (again, courtesy of JP Morgan Asset Management) you will see the forward P/E ratios for the S&P 500 over the last 25 years. Perhaps they are cheap for a reason, but for a long-term investor, stocks appear to be more attractively priced today as compared to three months ago. So hang in there.
Oil and Gas
Perhaps no sector was hit harder than oil. The price for a barrel of crude oil dropped from a high of roughly $76 in October to a low of $42 in December—an approximate 45% drop. This was certainly painful for oil investors but what about the average consumer filling up their gas tank? Take a look at the national average price per gallon of unleaded gasoline during the last three months of 2018:
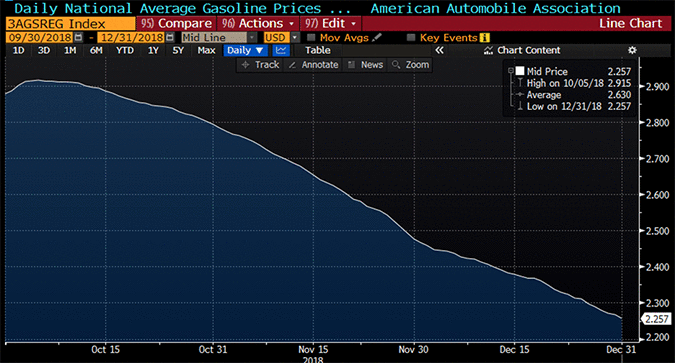
In the consumption-based US economy, saving money at the pump is a major economic stimulus. When consumers save at the pump, they have more money to spend (or better yet: invest).
If the US economy is largely powered by consumers’ spending, an increase in wages should also be positive for future growth. As of December 31st, average wages in the US increased at an annual, seasonally adjusted rate of +3.3%. That happens to be the highest rate since the financial crisis. Higher pay generally results in higher spending.
The Yield Curve Inversion
For our final thought, here is a twist to what most have perceived as a negative. You have probably seen the headlines akin to “Stocks Sell Off as Yield Curve Inverts, Signaling a Recession.” Without getting too technical, history tells us that when the yields of long-dated bonds drop below the yields of short-dated bonds a recession follows. True ... sort of.
Since 1962, there have been nine such inversions. Recessions occurred after seven of those, or 78% of the time—which is a decent rate. However, this “rule” tells us little about WHEN the recession might occur after the inversion and it does not say anything about the stock performance that might follow. Take a look at the following graph:
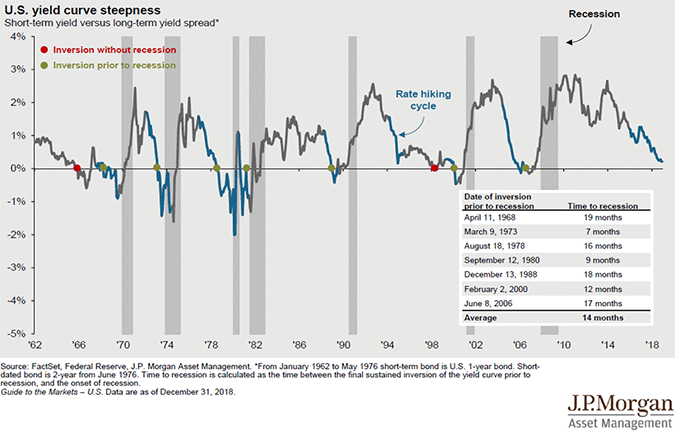
Is this time an exception to the “rule”? Perhaps there is more to this story. US interest rates are still at historically low levels. This has been a result of many years of deliberate Federal Reserve actions spurring so-called “easy money” and low interest rates. However, of late, their reversal of policy has raised short-term rates to roughly equate to current inflation. Further, demand for longer dated US Treasury paper is artificially high because of the relatively low interest rates on long-term paper existing in Europe and Japan. In turn, this is driving up prices on longer-term US Treasury notes and bonds and thus keeping long-term interest rates low.
It’s clear the rule doesn’t always work. And even when it does, it doesn’t tell us when recessions might occur. Not exactly a sure-fire stock trading signal.
Reminder that headlines sell. Just do not sell stocks based on headlines alone.
Actionable Ideas
So what is an investor to do in times like these? First and foremost, focus on what you can control—namely your adherence to your overall investment plan. If the plan calls for long-term capital appreciation, you will want to maintain equity exposure. If recent volatility has you itching to make changes to lessen its impact, perhaps it is time to rebalance or reevaluate the types of stocks or stock funds you own. Do you own growth stocks, value stocks, dividend stocks, large cap stocks, small cap stocks, international stocks? What is the mix? Is that the right mix for you?
If the plan calls for high exposure to fixed income, assess how bonds might react if the US Federal Reserve continues to raise rates. Typically when interest rates go up, the longer the term, the more sensitive the bond’s price will be. Therefore, in addition to the credit quality and geographic allocation of the bonds you own, it would be prudent to assess their duration and average maturity.
If you are comfortable with your investments and asset allocation, perhaps shift your focus from the markets to other important aspects of financial planning.
Ask yourself the following questions:
Did I fully fund my 401k, IRA, and Roth IRA?
Did I increase my contribution into my 401k when I got that pay raise?
Do I have any old 401ks that should be rolled over to my IRA?
Did I deposit my kids’ holiday checks into their UGMA, UTMA or 529 Plan?
Do I need to update my will or estate plan? Should I accelerate gifts to my beneficiaries?
Does my cash reserve cover three to six months’ worth of expenses?
When was the last time I met with my accountant to review how recent tax reform affects my tax status?
If you do not have a financial plan, create one. If you feel lost, we can help. Often times the impact of proper financial planning compensates for short-term swings in investment returns and helps you sleep better at night.
A note from the CEO:
2019 marks our 19th year in business. Perhaps more impressive is the six-member CastleKeep team now counts more than 100 collective years in the financial services industry. What is gratifying to me is that much of that investment experience has been within the firm.
We could not have done it without the trust and confidence of our clients, some of whom have been with us since the very beginning. It is incredible to think we are approaching 20 years and we are eternally grateful.
We would also like to thank our clients for their referrals! 2018 was the best year in terms of adding new clients in more than ten years. We truly appreciate the support and trust it takes to refer friends, family and colleagues.
On a personal note, in November 2018, Steve Haberstroh and his wife Erin welcomed their first born, Mac Haberstroh, into this world. Mom and Mac are healthy. And Steve couldn’t be more proud—and busier forecasting the cost of college in 2036.
There are a few thoughts I would like to leave you with given the positive market performance so far this January. First, each year much energy is spent answering the question of “how will the markets perform next year?” A somewhat subtle way of finding out what’s hot and what’s not. How many risk-on, risk-off calls are made throughout the year?
We all have to remember that instant analysis has its virtues, but is mainly geared to cause more trading.
Secondly, measuring performance for the year ending December 31, 2018 is convention and convenience. What happens when we experience a V-like movement in US equities like we’ve experienced over the last eight weeks? When investors experience pain, they are prone to react—to relieve the pain i.e., to sell—at low prices.
That is why there are folks like CastleKeep to help investors get through both the anguish of market pain and the exuberance of market euphoria. Our primary mission is to help keep our clients focused on the process in order to achieve their investment objectives.
Lastly, I would like to thank the growing CastleKeep family. Thank you for your commitment to CastleKeep and more importantly for your dedication to our clients—it is greatly appreciated!
Best wishes for a happy, healthy and prosperous 2019!


