


CKBlog: The Market
Thursday, July 24, 2025
2025 Semi-Annual Review
by Steve Haberstroh, Partner
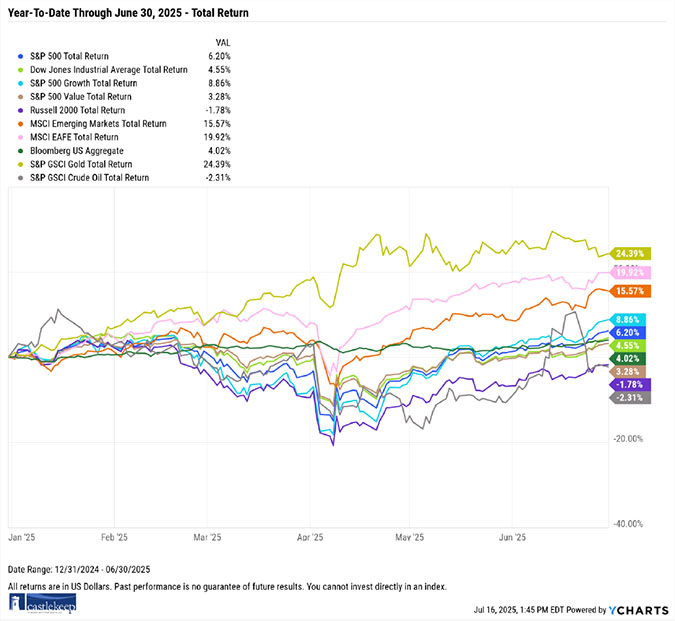
First, a look at year-to-date returns by asset class for the first half of the year through June 30th:
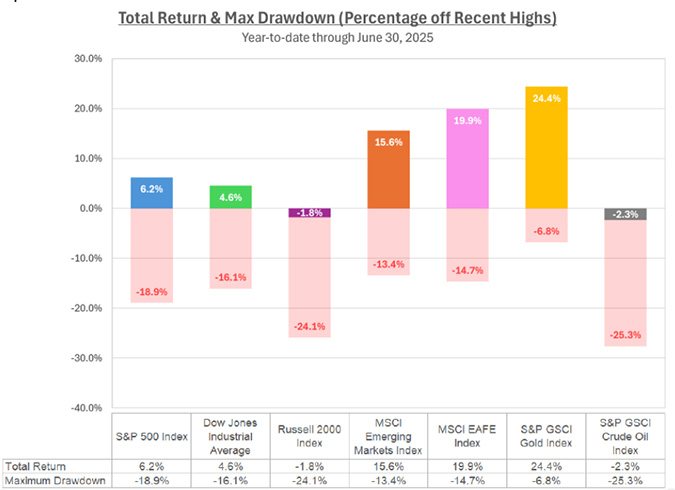
You will note a sharp selloff for several of these indexes during April. To demonstrate the dramatic downturns experienced in various markets, we have included the following chart that depicts the “maximum drawdown” (the percentage drop from the previous high point) for some major indices. The solid-colored bars indicate the total return for the first half of the year through June 30th. The shaded red bars below the returns depict the max drawdowns for each index during the same six-month period.
As an example, the S&P 500 Index finished the first six months of the year with a positive total return of 6.2% yet it had experienced a steep decline of 18.9% from its previous high in February down to its low on April 8th.
You wouldn’t necessarily know it by just looking at the year-to-date returns for most equity indexes, but the first half of 2025 was the most volatile since the depths of the COVID pandemic. In fact, we felt that the market dynamics plus client interactions during March and April were reminiscent to that of 2020. Note the following 5-year chart of the Volatility Index (VIX) which measures the expected near-term volatility in the stock market. The higher the line, the greater the “fear sentiment” implied by volatility in the markets:

Yes, we just lived through that dramatic spike toward the right of the chart.
Uncertainty was the norm. It seemed markets were living headline to headline. Tweet to tweet. It didn’t matter the time, or day of the week, things appeared to be moving and moving fast.
In fact, during a team meeting in early April, we happened to glance at our phones to realize that the S&P 500 Index jumped up 10%. Sure enough, President Trump had just announced a 90-day pause on tariffs.
Earlier that week we fielded numerous calls from clients asking whether going to cash was the right move. We advised that it’s rarely, if ever, the wise move for long-term investors. We didn’t know when markets would bottom nor how long it would take for them to recover. Just like every major selloff in the past, whether initiated by recession, war, or pandemic, the market eventually reaches its bottom ... and bounces back. Sometimes when investors least expect it. This time it was no different.
As we wrote to clients on April 3rd, just days before the low on April 8th:
Politicians come and go. But the dynamism of the American Economy has never been defeated. So why try to fight against it by periodically sitting on the sidelines?
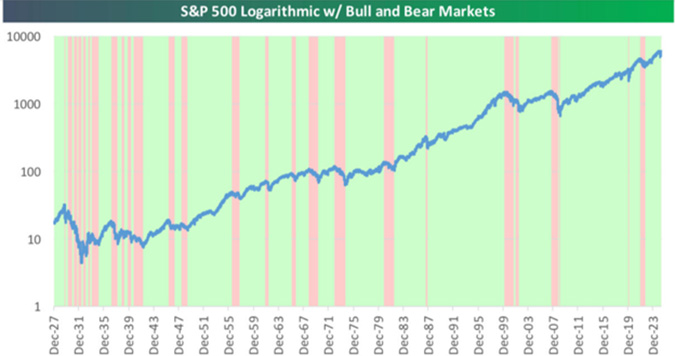
This can be demonstrated using historical data. Consider the graph below from Bespoke Investment Group. It is a chart depicting the length of time for bear markets (red) versus bull markets (green). Why spend energy trying to avoid the “red” when the stock market is “green” for longer and far more often?
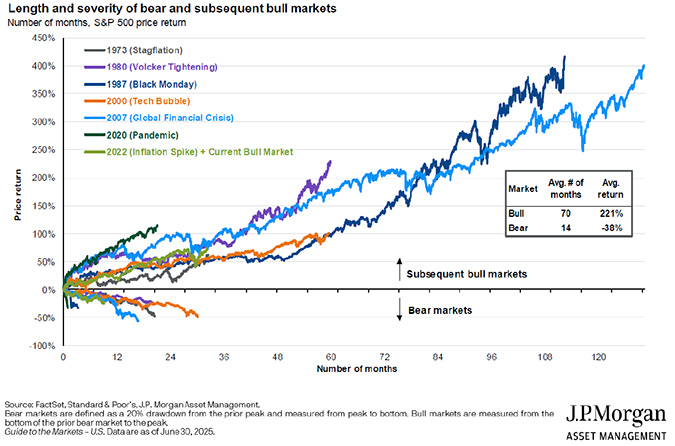
The same concept is driven home by another version of this chart. JP Morgan depicts the severity and length of bear markets in a series of color-coded downward sloping lines. Then, using the same colors, it plots the strength and length of recoveries. Which would you prefer?
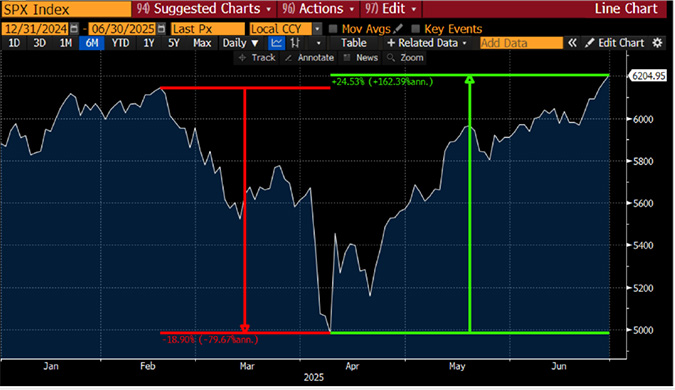
Another V-Shaped Recovery
Some corrections take years to rebound back to new highs. This one took weeks. After closing down on April 8th by roughly 19% off from recent highs, the S&P 500 Index rebounded by over 24% from the lows through June 30th to close the first half of the year up roughly 6%.
Imagine an investor liquidating their portfolio and going to cash in early April. Then imagine watching as markets rebounded to new highs. It may have been difficult to hang on in April, but imagine how difficult it would be to buy back in today had you locked in losses and missed the rebound.
This underlines the point that successful market timing requires being right twice. Investors tend to recognize downside risk well. When the headlines are negative, it’s easy to sell. It is less obvious to determine when to get back in.
We will experience another sell-off because they’re a natural part of the market cycle. When we do, try to remember the graph of the S&P 500. It can take years to recover but it can also happen in a matter of weeks. Stay the course.
Where Are We Now?
Most pundits agree the majority of the sell-off was attributed to the uncertainty surrounding the Trump Administration’s tariff policy. While few if any trade deals have been signed, it seems the market is willing to look past the worst-case scenarios. Inflation remains benign and there is talk again of the Fed potentially cutting rates toward the end of 2025. However, if we’ve learned anything, it doesn’t pay to try and predict the Fed’s movements.
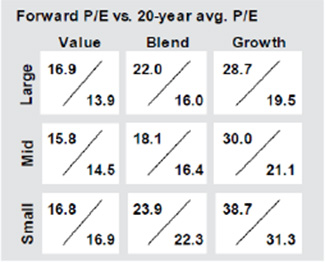
In the US, given valuations, stock market participants are signaling optimism. Using Price to Earnings Ratio (P/E), where a company’s stock price is divided by its expected 12-month forward earnings, smaller capitalization stocks remain “cheapest” and large growth stocks (think Nvidia, Tesla, etc.) are still very expensive relative to their historical norms.
Bonds have been getting their fair share of headlines as well. Because when rates move higher as they did in April, bond prices moved lower (all else being equal), investors holding those bonds saw paper losses on their positions.
Many pundits sounded the alarm as interest rates on longer term debt moved higher. Their concern was that the global investor was moving away from owning US debt somehow affirming that US creditworthiness was deteriorating. Moody’s agreed as they were the last of the major credit agencies to downgrade US debt to AA from AAA.
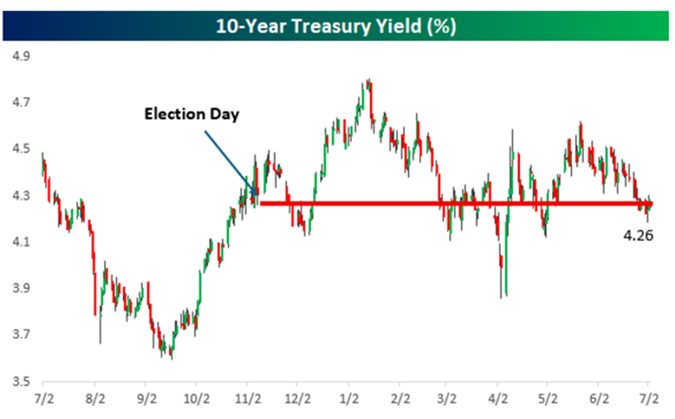
But some perspective is warranted. While yields may have spiked on the US ten-year bond, they are currently trading at levels seen as recently as last fall. See the following graph also from Bespoke Investment Group.
What about the global investors’ move away from the US? Is so-called American Exceptionalism behind us? Data suggests otherwise as depicted by JP Morgan.
On the left side of the chart, you can see that while foreign ownership of US Treasuries has declined from their highs in 2014, the foreign ownership share is up since 2024 and well-higher than at the turn of the century.
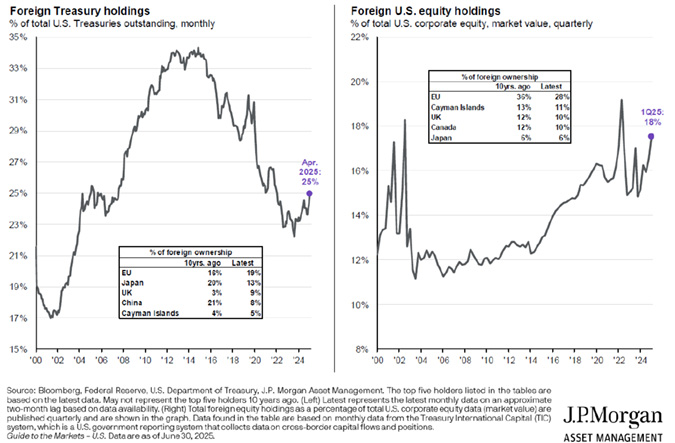
Did the global investor leave US stocks? It is true that foreign ownership of US stocks is off from its highs, but JP Morgan’s chart on the right certainly doesn’t depict investors running to the exits. In fact, the trend since the turn of the century is increasing foreign ownership of US equities.
Non-US Stocks
Speaking of the global markets, stocks traded outside of the US have been on a winning streak. In reality, European stocks, as represented by the MSCI European Index were up nearly 25% in US Dollar terms year through June 30th, besting the S&P 500 Index by nearly 20%— mostly due to the depreciation of the US Dollar!
As a result, exposure to non-US stocks has been a positive for well-diversified portfolios this half year. And as is often the case, this came when most least expected it.
“Big Beautiful Bill”
While it was signed into law after June 30th, we thought it worthy of a quick summary of the One Big Beautiful Bill Act (OBBBA).
For business, benefits include bonus depreciation on qualifying capital expenditures and enhanced deductions/incentives for medical research and agricultural expenditures.
For individuals: the bill makes the current marginal tax rates and standard deduction permanent, temporarily increases the so-called SALT deduction to $40,000 (welcome news to those in the Tri-State area like NJ, NY and CT), provides $25,000 deductions for qualifying tips and overtime wages and makes the Federal Estate Gift Tax Exemption permanent at $15 million per person increasing by inflation each year starting in 2026.
Once the proverbial dust settles, we’d encourage you to speak with your qualified CPA AND Estate Planner regarding your personal tax situation. Please feel free to loop us in so we can take advantage of any valuable tax planning.
Buffett Takes a Back Seat
During this year’s Berkshire Hathaway Annual Shareholder Meeting, Warren Buffett who turns 95 this August, surprised the forty thousand people in attendance, including the Berkshire Board by announcing his intention to step aside as CEO into a non-executive chairman role by year end.
In classic Buffett style, he had only told family members of his plan the day prior and wanted the Board to have an opportunity to evaluate the decision on their own. In a subsequent meeting, the Board deliberated for minutes and approved the plan to have Greg Abel take over as CEO of the eighth largest publicly traded company by the end of this year—the culmination of a plan that has been in place since the Board first chose Abel as Buffett’s successor in 2018.
As long-time followers of Buffett’s Berkshire Hathaway and as a fiduciary that has held Berkshire stock for certain clients for many years, we continue to follow these events closely. While having (arguably?) the greatest investor of all time at the helm of the conglomerate gave us unique comfort, we have invested in Berkshire for more than Mr. Buffett’s stock picking prowess—a skill that has become less important to the bottom-line results over the years as operating earnings have grown.
Berkshire Hathaway is a cash generating behemoth with direct exposure to most parts of the US economy (and increasingly abroad). Buffett and Munger (RIP) built the firm with a unique culture that will surely outlive most current shareholders. We expect Greg Abel will continue to build upon the foundation created by his predecessors and expect the operating earnings of the company to continue to grow. At the same time Buffett has stated publicly that Abel has been a terrific capital allocator while running Berkshire’s energy business and he expects the same while CEO.
True, Mr. Abel has big shoes to fill, but we aren’t expecting him to be the next Buffett—no one can be expected to replicate Buffett’s success. Abel’s role is vastly different from when Warren took over the struggling textile company some 60 years ago and compounded the firm’s book value by over 5.5 million percent!
From Berkshire’s latest annual letter (second column is the S&P 500 Index performance):
![]()
With a collection of healthy and growing subsidiary companies, a diversified portfolio of large multinational public stocks and a cash hoard approaching $350 billion, there is reason for optimism for Berkshire after Buffett.
25th Anniversary
While not the size and scope of Berkshire Hathaway (obviously), we recently celebrated CastleKeep’s 25th anniversary. Along with the 25 years, we are at a record high in number of clients, as well as assets under management.
Needless to say, none of this would have been possible without the support of our dedicated team members, custody and banking relationships, asset management firms, our family members, and most of all our clients; many of whom have been with us for more than two decades.
It has been quite a journey, and we want to thank every one of you who have supported us along the way. We are so grateful and proud of our history and are excited for the next 25 years (and more)!

Pictured from left to right: Christie Pasqua (Customer Relationship Manager), Lauren Quesada (Partner), Steve Haberstroh (Partner), Charlie Haberstroh (Founder and President), Chuck Haberstroh (Partner) and Mary Hackett (Office Manager).
We thank you for your trust and confidence.
The CastleKeep Team
July 21, 2025
PDF version of this post: 2025 Semi-Annual Review