


CKBlog: The Market
Thursday, January 23, 2025
2024 Market Review: Can US stocks do it again?
by The CastleKeep Team
The S&P 500 Index has logged two straight calendar years generating a 20% return each year. Is the market overheating? Can the positive momentum continue?
Our 2024 review will attempt to answer this and discuss compelling themes to examine from the past twelve months and what to keep an eye on for 2025 and beyond.
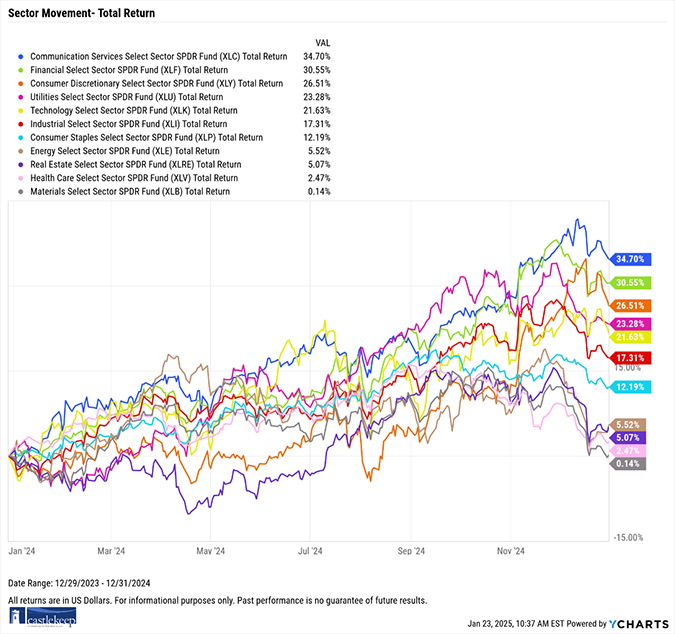
But first, a summary of returns for major indexes followed by the returns per sector in the S&P 500 for calendar year 2024:
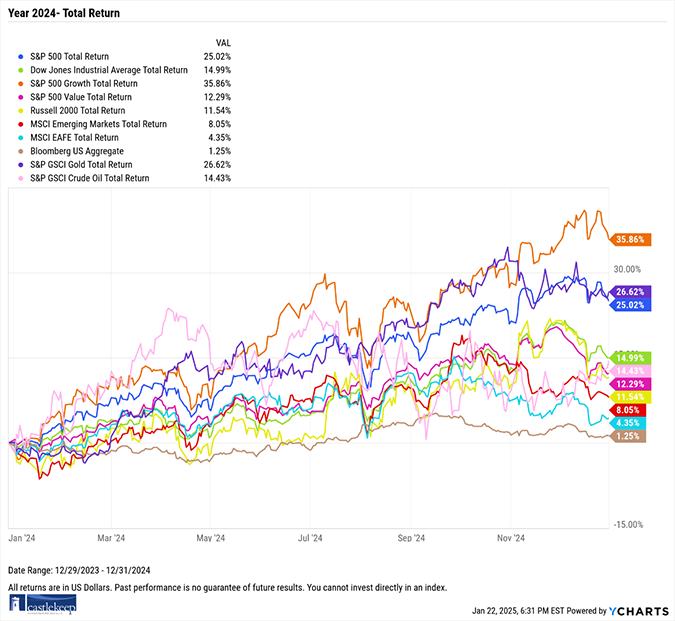
Much like 2023, it would have been difficult to construct a fully invested portfolio one year ago that lost money in 2024. That doesn’t mean remaining 100% invested was easy. To start the year, many feared that the upcoming election cycle would derail the market. Many were considering hiding out in the safety-zone of 4% yields on cash in high-yielding savings accounts or money market funds. We encouraged clients to remain invested and emphasized the importance in staying the course—which pays off in the long-haul.
While the S&P 500 Index rallied 25%, diversified portfolios offered above average returns as well. Consider the traditional “60/40” portfolio of 60% stocks and 40% bonds where the stock exposure is made up of 45% S&P 500 Index and 15% MSCI World Ex-US Index and the bond portion consists of the Bloomberg Aggregate Total Return Index.
Such a portfolio would have posted a 12.55% total return in 2024.
With the S&P 500 Index delivering 26.26% return in 2023 followed by 25% in 2024, investors may wonder whether US stocks will be able to deliver again. The best way to tackle this question is by turning to historical data.
For some perspective, while the two-year performance of the S&P 500 Index is well above its average total return of 11.33% since 1950, if you go back three years to include the dismal 2022, the three-year annualized return for the index is 8.91%—slightly below its historical average. Recall that the S&P 500 Index lost 18.13% in 2022.
Consecutive returns above 20% is rare for the S&P 500 Index. There have been only four instances of this occurrence since 1950—three of which occurred during the late 1990s during the dotcom bubble. In all four cases, the market was higher the year after rising 20% in consecutive years. While the sample size of four is not robust enough to make meaningful conclusions, it does, however, show that another year of positive gains is possible. Not guaranteed, but possible.
Additionally, it is more common for the S&P 500 Index to deliver calendar year returns above 20% than it is to end the year with a loss. You read that right. According to Ben Carlson of Ritholtz Wealth Management in his blog called A Wealth of Common Sense, “Since 1928, there have been 34 instances where the S&P 500 has finished up 20% or more against 26 total down years.” What Happens After a 20% Up Year in the Stock Market? A Wealth of Common Sense, 2023.
Lastly, if we are in the midst of a bull market, history would suggest that at just over two years old, we are likely in the early innings (needless to say there are no guarantees of how long bull markets last). JP Morgan Private Bank’s January 2025 Key Investment Themes report clearly reflects this notion in the following graph:
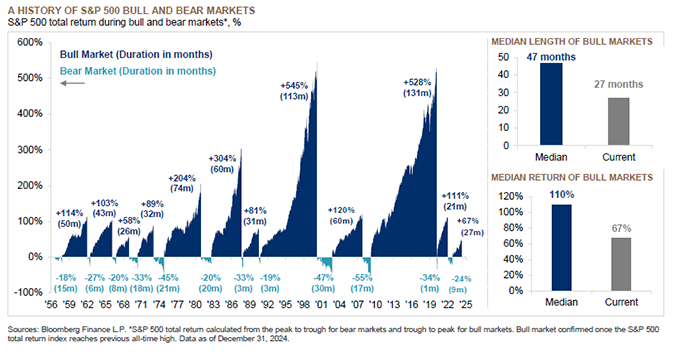
The median length of bull markets is 47 months. The current bull market is in its 27th.
Concentrate on Concentration
The top 10 publicly traded companies in the S&P 500 Index represent nearly 40% of the index. Therefore, these companies will have more of an impact on the performance of the index than ever before. This dominance of the S&P 500 Index affects the valuation of the index. Given the relatively high Price-to-Earnings (P/E) ratios of the top 10 companies, the S&P 500 Index is more expensive than its historical average.
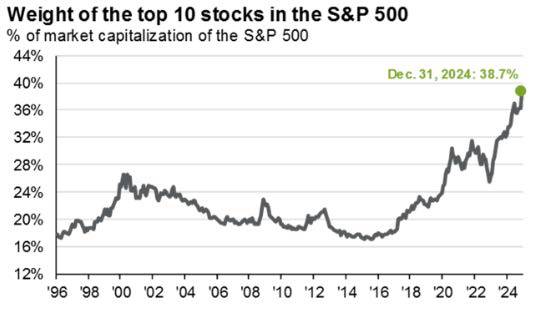
As of December 31st, 2024, the forward P/E ratio of the top 10 companies was 29.8. The P/E of the remaining 490 stocks within the S&P 500 Index was 18.2 or nearly 40% cheaper than the top 10. When pundits say “the market is expensive” what they are really saying is “the top 10 companies are expensive.” True, they are also very profitable and have experienced impressive earnings growth and some are deemed as “market disruptors,” but there are plenty of opportunities for investors to find less expensive companies to invest in that have above average future growth potential.
US 10-Year Treasury Note and Duration of Bonds
Bonds typically lag the returns of stocks and are viewed as a more conservative approach to investing. Bond holders lend money to corporations or governments in exchange for a coupon payment for a set period of time. Upon maturity, the principal is returned.
A common example is the US 10-Year Treasury Note. On December 31st, 2023, an investor could have purchased a bond backed by the US Government that paid them interest equal to roughly 3.9% per year. If that investor holds the bond for the full 10 years and the US Government was solvent and able to repay their debt, that investor would receive their principal back in addition to the yield of 3.9% per year for 10 years.
But during those 10 years, the price of the bond would surely fluctuate based on prevailing interest rates. A good example of this can be seen in the following graph of the yield on the US 10-Year Treasury Note during 2024:
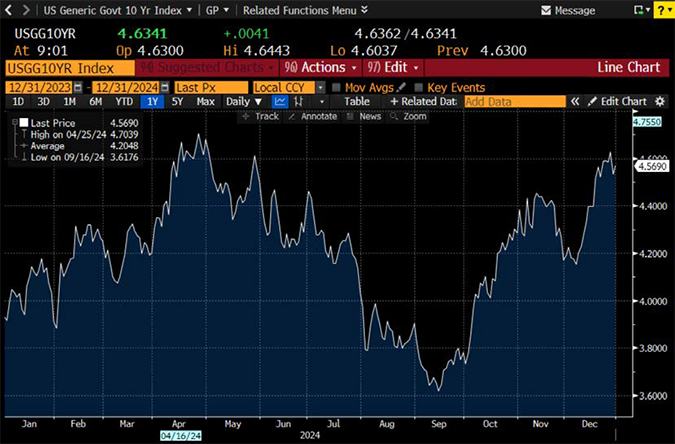
To start the year, investors could have “locked in” yields of roughly 3.9%. By late April, a new buyer of 10-year paper would have locked in 4.7%. In September, yields had dropped to 3.6% then recovered to close the year at 4.57%. As we write this letter, the 10-year yield sits just shy of 4.65%.
Bond prices have an inverse relationship to their yields. As yields climb, bond prices drop all else equal. Intuitively, this makes sense. Take the investor who locked in the 3.9% yield to start the year. By April, that 3.9% was no longer attractive as the market was now offering 4.7% yields. To sell the 3.9% yielding bond, the investor would have to sell it at a discount. Why would anyone want to pay full price for a lower yield than the market was paying?
In an environment where interest rates moved higher on the long end of the yield curve, investors were better off allocating to short-dated instruments or bonds whose coupons float with prevailing rates (if rates rise, so does the coupon paid to investors).
Take the following real-world example that considers the growth of a $10,000 investment in each of three bond ETFs over the last three years during the current rising rate environment.
iShares 20+ Year Treasury Bond ETF (ticker TLT): Invests in long-dated government bonds with a fixed-rate.
SPDR Bloomberg 3-12 Month T-Bill ETF (ticker BILS): Invests in short-dated government bills, notes and bonds with a fixed-rate.
iShares Floating Rate Bond ETF (ticker FLOT): Invests in bonds with variable interest rates that float with prevailing interest rates (coupons are not locked in).
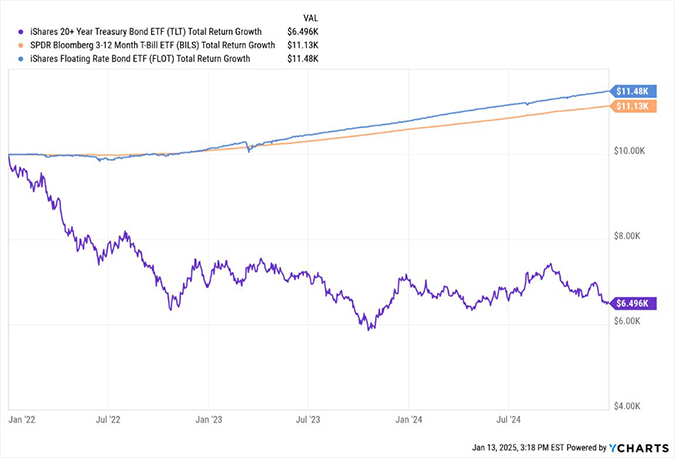
Over the last three years, the $10,000 investment in the longer-term oriented TLT was worth less than $6,500 by the end of 2024, whereas the investments in the shorter-term-oriented BILS and FLOT were worth more than $11,000.
Investors who kept their fixed income exposure on the shorter-end of the yield curve have been rewarded of late.
Non-US Stocks
We have written for years that non-US stocks have a place in portfolios despite lagging performance relative to their US counterparts. These stocks continue to be less expensive and offer higher dividend yields. They should also provide diversification over the long term.
Given how long it has been since the last period of outperformance for non-US stocks, we want to remind you that, indeed, it has happened. Below is the total return of the MSCI World Ex-US Index (in purple) versus the S&P 500 Index (in orange) between December 31, 1999 and December 31, 2007. Over that seven-year period, the world equity markets outside of the US delivered a total return of over 60% compared to 14% for US stocks.
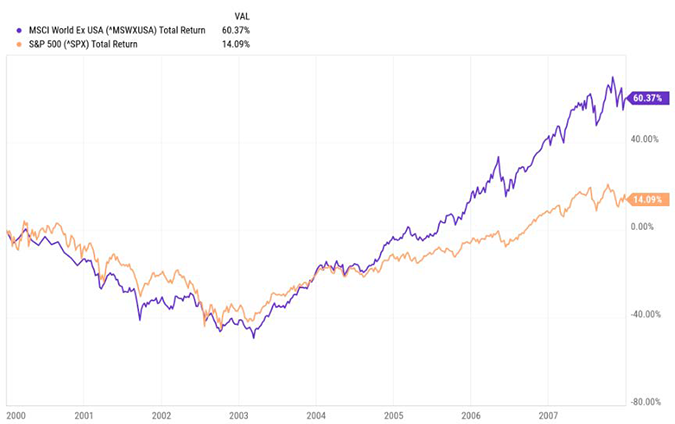
We remember a time when market consensus was that all the corporate earnings growth was outside of the US ... .
Bitcoin
We rarely reference cryptocurrencies in our past letters. But 2024 marked two significant events for Bitcoin. First, it briefly traded above $100k per “coin.” Second, major financial institutions including Fidelity, Blackrock, and Bitwise were approved to offer Bitcoin ETFs. Investors can now easily own crypto in their brokerage accounts.
Many view this as a signal that large institutions are predicting massive gains for the price of Bitcoin moving forward. We remind you that firms like Blackrock aren’t necessarily making predictions that crypto prices will rise, rather, they are taking advantage of a cohort of folks who wish to hold crypto in brokerage accounts. These institutions are making massive fees for the privilege of providing you easy access to crypto.
The largest bitcoin ETF with over $50 billion in assets under management is Blackrock’s iShares Bitcoin Trust (ticker IBIT). With an expense ratio of 0.25% per annum, Blackrock collects over $125 million per year for their product at these asset levels. Not a bad business.
Offering crypto to main street investors is good for Wall Street.
Federal Funds Rate Expectations May Be Way Off Base
Investors have been paying very close attention to the Fed’s actions and expectations, most notably on Fed Funds rate decision days. Fed Chair Powell’s press conference after the 25-basis point cut on December 18th was a good example of this. Stocks opened the day higher then finished the day with the S&P 500 trading lower by almost 3%. Most pointed to Powell’s seemingly conflicted view about whether rate cuts will continue. He cited the continued strength of the economy as the rationale for potentially pausing rate cuts. Economy strong, stocks down?
Market participants take Fed decisions and commentary then set expectations for where interest rates are likely to be in the future.
But do these predictions come to fruition? The answer is no. It turns out market participants are no better at predicting the future than the reader of this letter. Evidence of this is clearly depicted in the Financial Times chart below from their recent article titled “Never Make Predictions;”
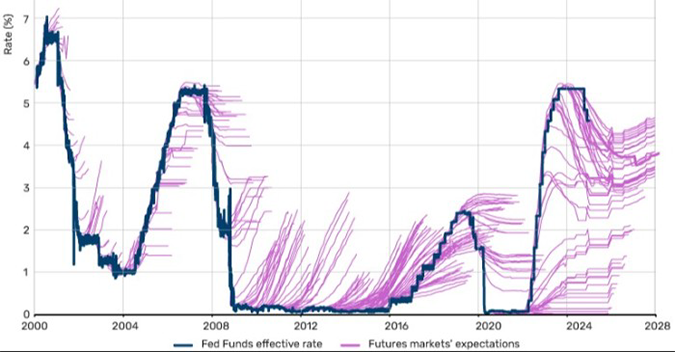
Source: Never Make Predictions; Financial Times; December 18, 2024
It may take a minute to digest, but it is worth the effort. The blue line tracks actual Fed Funds Rate going back to 2000. The purple extensions represent the market expectations for rates into the future on the dates being tracked on the blue line.
Expectations were woefully inaccurate—particularly of late. Had they been more accurate, there would be little dispersion between the blue and purple lines, and they would have tracked very closely. But they haven’t.
Focus on the stretch coming out of the Financial Crisis from 2008 to 2016 or so. As depicted by the purple lines, markets predicted rates would rise substantially and kept incorrectly pricing this in. Then, after rates finally rose, the market predicted they would level off only to cascade downward during the COVID-19 pandemic. After that market participants continued to get it wrong. Just look at those purple tentacles!
Today we sit where the blue line ends. Should an investor trust the market expectations about where rates will go? Should they make dramatic investment changes based on how markets interpret actions and words by the Fed? We would suggest not.
Trump Administration
If President Trump’s last term is any guide, we should expect many twists and turns over the next four years of his administration. While Republicans do control the House and the Senate, it is by a slim margin. This should help keep any massive changes at bay.
On balance, if successful, the Administration appears poised to lower taxes and implement (or threaten) tariffs to “protect” US manufacturing and enforce foreign policy. Lower taxes (without resulting in incremental GDP growth as a result) may lead to larger deficits and potentially a short-term tick up in inflation. This may partially explain the recent rise in interest rates as investors are demanding to be paid more for the risk of holding longer-term debt.
The Administration also seems poised to be business friendly, especially to the energy and financial sectors. We believe this will have a positive effect on earnings and the stock market as a whole.
We do not focus on rhetoric. As policies become law and as regulations change or are eliminated, we may make tactical changes to investments. But just like during Biden’s Administration and the administrations before him, we do not tend to make drastic changes solely based on who is in office.
Current Economy
Current data suggests the US economy remains strong. Unemployment is near historical lows. Inflation, albeit higher than the Fed’s target, is stable. Household finances are strong, evidenced by the amount of debt payments compared with personal disposable income (refer to the chart below). Household net worth sits at all-time highs (think in terms of home values and investment portfolios minus debt).
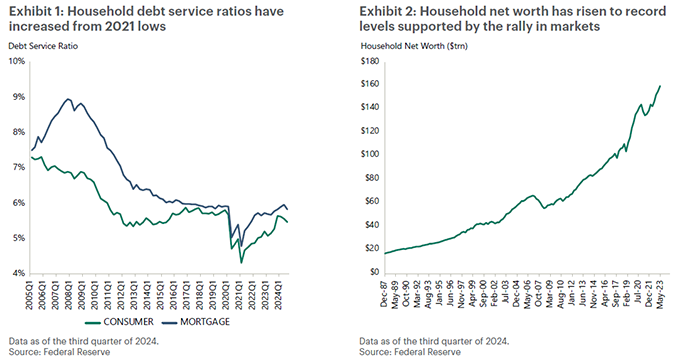
Source: Apollo’s 2025 Credit Outlook: Defying Gravity; January 14, 2025.
Corporate profit margins are at all-time highs. Debt service for corporations, similar to individuals, is manageable despite increases in interest rates as many corporations locked in lower rates on long-term debt during the pandemic.
Indeed, according to the Atlanta Federal Reserve, which uses “real-time” data to model current quarter GDP growth, the US economy is growing 2.7% net of inflation in the fourth quarter of 2024 (Federal Reserve Bank of Atlanta; GDPNow Research).
While various economic dynamics and market activity signal fair reason to remain positive, we still would not recommend going “all-in” on stocks. True risk lies in what you cannot see which is why we maintain balanced portfolios.
CastleKeep has been managing and safeguarding client assets for nearly 25 years. Our CIO has been in the investment industry for over 50 years, and we believe that with experience comes wisdom. It would be prudent to not get too aggressive despite most indicators reading “bullish.” Our objective is to participate on the upside while protecting the downside.
Conclusion
It was a positive year for markets and for client portfolios that were invested through the calendar year. At the firm level, CastleKeep continues to grow. We added Christie Pasqua to our client service team, successfully managed the integration of over 50 households, and closed the year with record assets under management—none of which happens without the continued trust and confidence placed in us by our dear clients.
Our team thoroughly enjoys interacting with clients and others interested in our process. So, if market dynamics or changes within your personal finances are on your mind, please reach out. We would be thrilled to see if we can help.
Sincerely,
The CastleKeep Team
January 23, 2025
2024_Market_Review (PDF)