CKBlog: The Market
Monday, August 05, 2024
August Sell-Off
by Steve Haberstroh, Partner
The stock market has gotten jittery. It’s not every day that a two day sell-off (with more selling so far this morning) would warrant our reaching out. However, the action over the last two trading days has been stark.
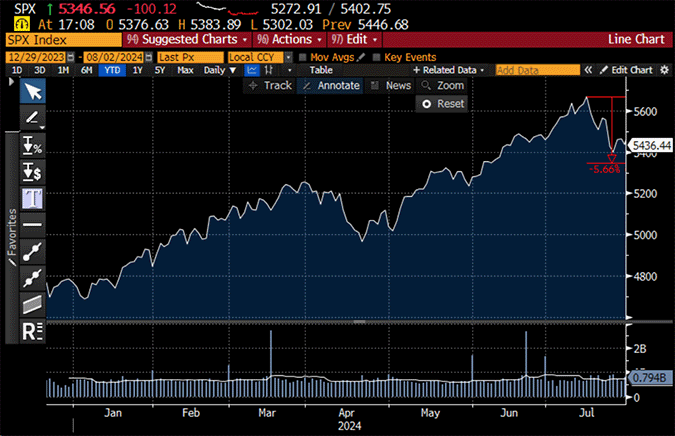
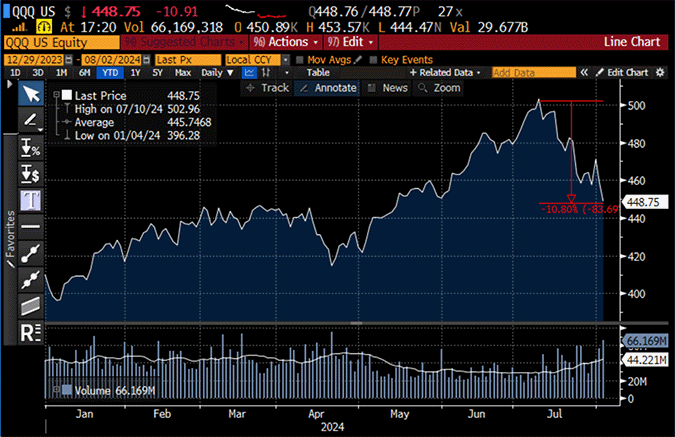
Since the market close on Wednesday, the S&P 500 Index dropped more than 3.5% in the previous 2 days. The NASDAQ 100 dropped more than 5%—which has been in contrast to what the market had been delivering in the last number of months.
As of the close on Friday, the S&P 500 Index was down 5.66% from its highs last month.

The NASDAQ 100 is in a technical correction, down 10.80% since its high last month.

Sell-offs can be frightening. But for perspective, the S&P 500 Index is now trading at levels not seen since ... May of this year. The pain may continue, but it is not as if we have wiped out years of gains thus far.
Just like we did not advise clients to “go all in” when markets were moving higher, we aren’t going to advise folks to “get out” due to the recent sell-off either.
So, what is causing major indexes to trade lower? It is impossible to ascribe one factor to markets, but we will offer some considerations:
- We were overdue. The market has been moving steadily higher for some time. In fact, the S&P 500 Index is up nearly 50% since the end of 2022 through July 31st of this year.
- The yields on US government debt have been moving lower over the last several weeks. After hitting a recent high of 4.70% in April, as of the close on Friday, the yield on the US ten-year government bond closed below 3.8%. To many, lower yields indicate an expectation of a weakening economy.
- On Friday, the Labor Department reported that July job gains were muted and well below forecasts. The unemployment rate ticked up to 4.3%—a level not seen since October 2021 (keep in mind such a rate is still considered very strong). This sent pundits into a bit of a frenzy, declaring that what had been viewed as a “soft landing” may be coming to a screeching halt. Our view is that just one month of a “weak” number should not derail one’s expectations for the dynamic US economy.
- Over the weekend, Berkshire Hathaway reported its second quarter results (operating earnings grew an impressive 15% year over year) including the disclosure that it halved its stake in Apple, while lowering its holdings of Bank of America and bought back little of its own stock. Some we left with thoughts that Warren Buffett thinks the market is overvalued (he has thought so for some time now). He may be correct, but it is important to remember, this quarterly report covers activities prior to June 30. Buffett rarely discusses what he buys and sells in real time but famously cheers when quality companies “go on sale.”
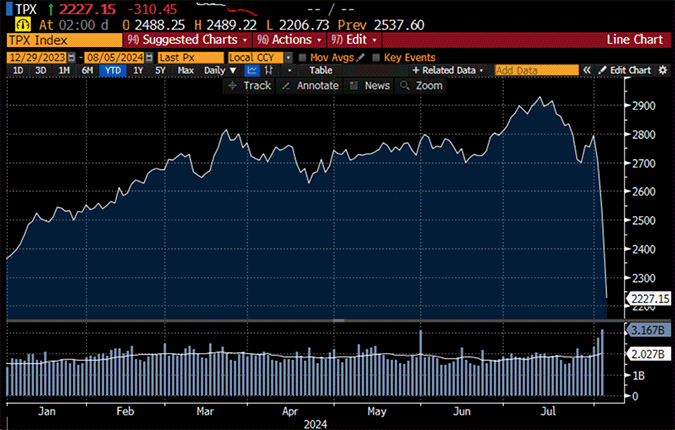
- The sell-off is global. The most severe taking place in Japan. Three trading days ago, Japan’s TOPIX (their equivalent of our S&P 500) was up 18% on the year. As of this morning, it is now negative on the year. Things can happen fast—look at the right side of the below chart.

One of the impacts of the latest economic data and movement in markets (both stock and bond) is that folks now see a September rate cut by our Central Bank as a near certainty, with many calling for more aggressive cuts. If that happens, borrowing costs on mortgages, auto, and business loans will become more attractive (while savings and money market accounts become less attractive), potentially fueling this currently growing economy further.
So what should you consider doing? Most of the time, it’s best to do nothing—that is if you have developed a sound investment plan. At CastleKeep, we are comforted by our diversified approach and are looking to make some tactical changes within portfolios in addition to potential rebalancing. For some clients who were over-allocated to cash, we will continue to purchase equities.
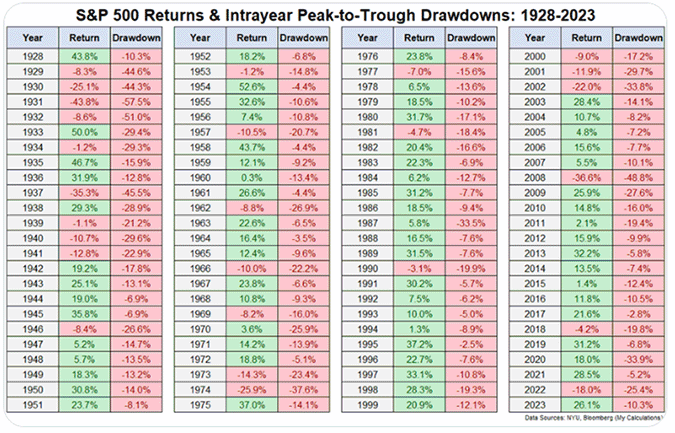
Lastly, volatility is more normal than you might expect. See the below chart from Ritholtz Wealth Management’s Ben Carlson. The red entries are the maximum draw downs during each calendar year for the S&P 500 Index since 1928. Sell-offs are common.

In fact, in 65% of the years since 1928, the S&P 500 Index had a drawdown of 10% or more. In 96% of the years, the index fell by 5% or more. As I write this, we are currently somewhere between the two.
Remind yourself this is normal.
If you would like to discuss your investments, please contact me at .(JavaScript must be enabled to view this email address). I’d be glad to put you in touch with our CIO and investment team should you want to drill down further.
Have a great week, hopefully far away from any thoughts about stocks! Let us handle that for you.
Sincerely,
Steve and the CastleKeep Team
August 5th, 2024
This entry in PDF format: August_Sell-Off


