CKBlog: Strategies
Monday, October 29, 2018
Value with Growth
by Steve Haberstroh, Partner
There has been much talk recently about the possible shift from “growth” to “value” stocks during the recent market volatility. I figured it would be valuable (get it?) to review why this may be happening.
Save a couple of minor corrections since the financial crisis, and on the back of the Fed’s “easy money” policy, US equity markets have more than tripled since March 2009. The strength of so-called growth stocks has been even more impressive. Investors keep pouring money into the likes of Amazon, Netflix, and Facebook just to name a few. So much so, these stocks are getting awfully expensive. As measured by Price to Earnings Ratios (P/E), the S&P 500 Growth Index (SGX) is now 41% more expensive than the S&P 500 Value Index (SVX). It also yields far less. Below numbers as of Sept. 30, 2018.
| P/E Ratio* | Dividend Yield** | Return YTD (Sept. 30) | |
|---|---|---|---|
| S&P Growth Index | 21.23 | 1.26% | 17.24% |
| S&P 500 Index | 17.89 | 1.85% | 10.56% |
| S&P 500 Value Index | 15.01 | 2.49% | 3.51% |
| Source: Bloomberg * Price/Bloomberg consensus estimates of next 12 months earnings ** Trailing 12 months *** Including Dividends | |||
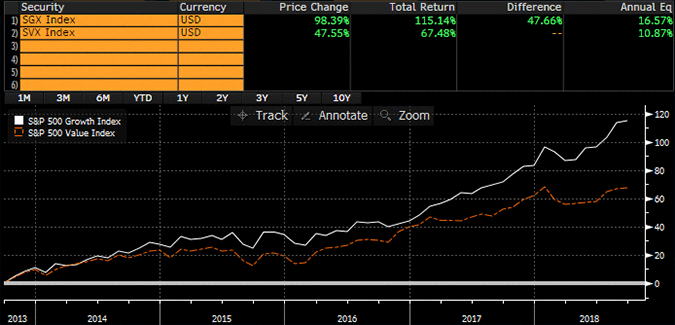
To be fair, “growth” companies are described as such for a reason. They have experienced more revenue growth as compared to their “value” counterparts for quite some time. Just consider the top five holdings of the S&P 500 Growth Index: Apple, Microsoft, Amazon, Facebook, and Alphabet (Google). Clearly, these growth stocks, and the growth index as a whole, are investments you would have wanted to own meaningful positions of for the last five+ years.
On the chart below, the white line represents the S&P 500 Growth Index, while orange represents S&P 500 Value Index.

Source: Bloomberg
As growth constituents continue their relative dominance, they begin to have outsized influence on the S&P 500 index as a whole. Tech stocks, which are classic growth names, are the prime example of this. Prior to the recent October sell-off in the sector, tech represented over 33% of the S&P 500. As I have written about before, the last time a sector represented north of 20% of the index (let alone 30%) was the financials in 2007 (we all know how that ended).
Take a look at the chart below. Markets tend to be cyclical. Do we think tech stocks will continue their ascent relative to other sectors harkening back to the dotcom era? Or do we think they are due to slow down?

Source: Source: FactSet, MSCI, Standard & Poor’s, J.P. Morgan Asset Management. Guide to the Markets—U.S. Data are as of September 30, 2018.
If growth stocks lose their momentum, it likely will be influenced by two factors which historically have spelled danger for high-priced growth stocks: decelerating earnings and rising interest rates.
- Decelerating Earnings:
You would be hard-pressed to find a company which has grown faster than Facebook. Founded in 2004, it took only 14 years to become the fifth largest publically traded company in the US. But back in July, during its quarterly conference call and in the wake of its security scandals, the company warned that the increase in spending on compliance and security would materially impact their profit margins and earnings growth going forward. That day, shares dropped -20%, erasing $120 billion of market cap (roughly the size of Nike), marking the largest one-day market cap drop for a single company in history. When earnings slow, high priced stocks get hit hard. When paying up for these stocks, you better hope their growth rates continue.
- Rising Interest Rates:
There is much debate as to the true impact of rising rates on high priced growth stocks. Many investment professionals argue that rising rates are destructive for growth stocks. The thinking goes like this:- When rates are low, there is very little opportunity cost to hold a growth stock (versus earning interest on cash for instance) and wait until they are profitable at some point in the future.
- Additionally, when rates are higher, equity analysis implies the use of a greater discount rate to measure the present value of future earnings.
- Growth companies typically use leverage as opposed to equity to achieve low cost of capital. Therefore, they have high levels of debt compared to equity in their corporate structure. As interest rates rise, interest payments and debt servicing may become more expensive which can hurt the bottom line. If the lenders have strict covenants in place, it can also lead to aggressive accounting practices and earnings manipulation by upper management.
Since the end of the quarter through the close of October 9th, the US 10-Year Government Yield increased from 3.06% to 3.21%. In the same period, the S&P 500 Growth Index was down -2.44%, Amazon was down -6.62%, and Netflix was down -4.92%.
How did the S&P 500 Value Index fare? It was up +0.53%.
Classic Value Stock
So what is an example of a typical value stock? Can a value stock grow earnings? Let’s take a look at one of the nation’s largest home builders, Lennar Corp (ticker LEN). Founded in 1954, the company has built and sold over one million homes. It has a market cap of roughly $18 billion and built nearly 13,000 homes in 2017, resulting in more than $12.6 billion in revenue.
But through September 30th of this year, the stock was down -26.02% as compared to a gain of +10.56% for the S&P 500 Index (both including dividends). With a forward P/E ratio of 7.27 as compared to 17.89 for the S&P 500 index as of September 30th, the stock is trading at a discount of nearly 60% to the overall market! Value stock.
So what in the world is going on here? Let me describe the narrative of why investors may have sold shares of LEN this year:
- mortgage rates are up, making new home purchases more expensive
- construction costs are up, making it more expensive to build new homes
- tariffs will increase the price of housing raw components, such as lumber, steel, aluminum, etc.
- wages have remained stagnant, leaving less discretionary funds for people to buy new homes
- those darn millennials just won’t move out of their parents’ basement! (kidding ... sort of)
Ok, I get it. The picture doesn’t look so bright if you focus on the narrative. But what about the company’s operating results? Orange represents actual results. Gray is forward looking based on consensus analyst estimates. Left side is revenue. Right side is earnings per share.

Source: Bloomberg
From 2014 through 2017, annual revenue increased by $4.8 billion or 62% and earnings per share increased by $1.0 per share or nearly 74%. Clearly, the company has been growing.
Ok, so maybe the growth is behind them? Not according to analysts. For fiscal 2018, analysts expect earnings to increase by another $8.1 billion or 64% (helped in part by their acquisition of CalAtlantic earlier in the year)! What about earnings per share? That is expected to increase by 46%. Even more impressive is that we are already three quarters through the year giving more certainty to these estimates. And if you believe the 2019 numbers, growth is expected to continue.
Maybe the company is running low on cash? Nope. The company ended 2017 with $2.3 billion in cash or 15% of their market cap.
The company is growing, is expected to continue to grow and has a bunch of cash on hand? Remind me again why it trades at a 60% discount to the market? It’s true that analysts don’t always get it right but Lennar would have to miss the mark by a wide margin for these valuations to make sense. Maybe they will. Time will tell.****
Difficult but Worth It?
It is true that being overweight to “value” has dampened portfolio results as compared to “growth” strategies as of late. But given their relative cheapness as compared to growth stocks and the expectation of a rising rate environment, we believe investing in value stocks has merit. The market may wake up to stocks like LEN.
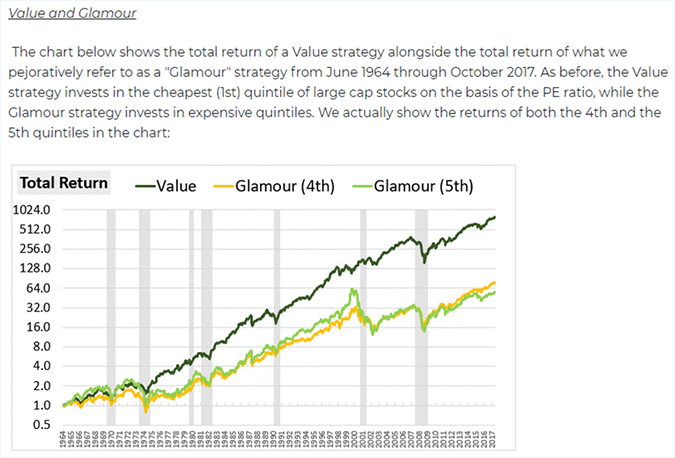
Investing in value stocks works over the long-term. Consider the following chart from O’Shaughnessy Asset Management. “Value” represents the cheapest quintile of Large Cap stocks by P/E Ratio. “Glamour” represents the most expensive Large Cap (mainly growth) stocks. Data goes back to 1964.
June 1964 - October 2017 Total Annualized Return

Value: 13.34%
Glamor: 8.54%
Difference: 4.80%
Source: Factors from Scratch: A look back, and forward, at how, when, and why factors work
By Jesse Livermore, Chris Meredith, CFA, and Patrick O’Shaughnessy, CFA
As O’Shaughnessy’s work points out, famed value investor Warren Buffett was on to something. But, despite its relative outperformance over time, value won’t always outperform. Nothing works that way. Value investors will have to withstand the difficult times to enjoy the good ones.
Take classic value fund manager Bill Nygren’s Oakmark Select Fund (ticker OANLX). If I told you that the fund underperformed the S&P 500 index 50% of the time for rolling one-year periods since its inception 22 years ago, would you be interested in investing? Well, if you did at the fund’s inception and remained invested through the September of this year, your capital would have more than doubled as compared to investing in the S&P 500 Index:

Source: https://www.oakmark.com/oakmark.htm
Growth has worked better for the last several years. Value has worked better over a longer period of time. So what is an investor to do? These asset classes aren’t mutually exclusive. You can invest in both at the same time. Whether you use your own stock picking, professional managers, or ETFs, there are many ways to get exposure to both growth and value stocks. Your risk tolerance and objectives should dictate the proper mix for you.
Just know that if you pick one style over the other you might get it wrong. The underperformance may last for a long period of time. And that’s ok. You’d be in good company.
As Buffett’s Vice Chairman, Charlie Munger, has said, “It’s not supposed to be easy. Anyone who finds it easy is stupid.”
Whether you tilt towards growth or value, the important thing is to stick with the investment plan that works for you. Staying in the game is the secret to building lasting value.
**** Disclaimer: Any reference to specific equities is for illustrative purposes only. CastleKeep does not recommend any referenced equity for purchase or sale.


