



CKBlog: The Market
Monday, July 27, 2026
2026 Semi-Annual Review
by The CastleKeep Team
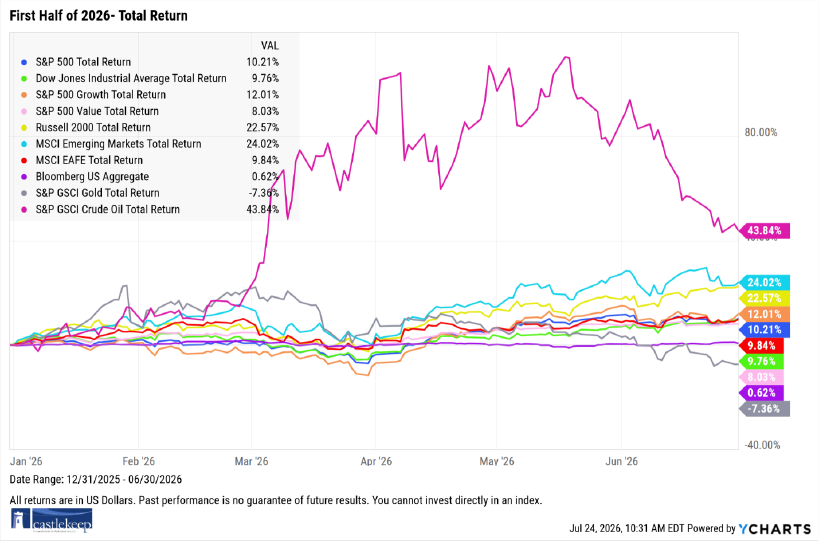
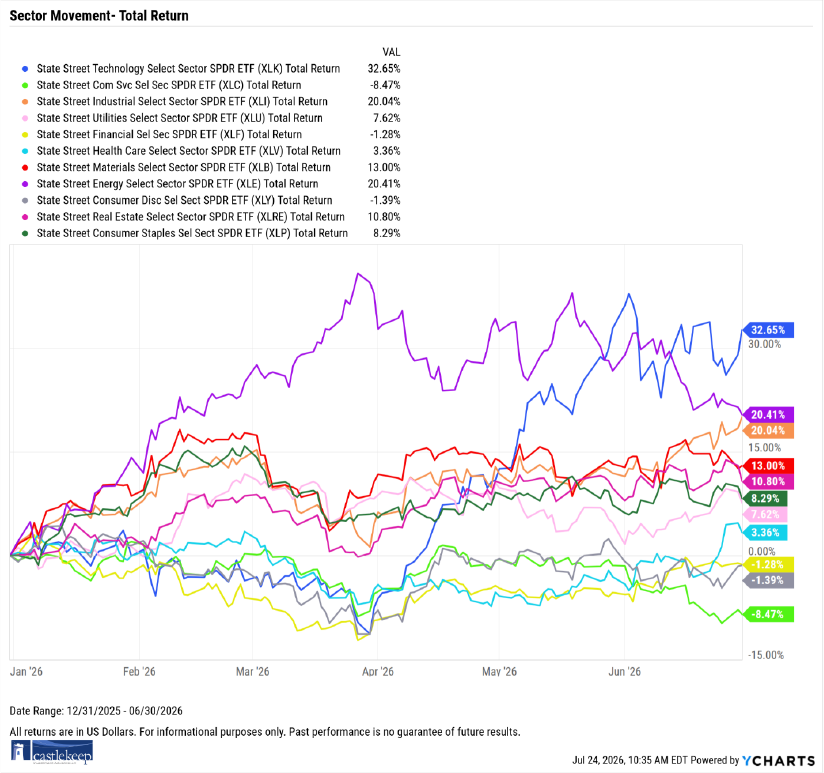
Markets continued their volatility in first half of 2026, buffeted by geopolitical events in the Middle East and the economic effects of the Iran War and AI investments. Underlying earnings growth continued to provide market buoyancy. We begin our report with a review of the various markets and sectors.
War in Iran
The first half of 2026 has shared similar dynamics compared to last year. Investors entered the year with a positive framework. Within months, however, geopolitical shockwaves sent markets into correction. While the correction was brief, its rebound was as abrupt as the sell-off. The overall market’s willingness to look past conflict left many confused just as they were last year during the tariff tantrum.
2025: “Why are markets shrugging off these tariffs? Global trade has been upended as we know it!”
2026: “Can’t the markets see we are at war? Do they not see the prices at the pump?”
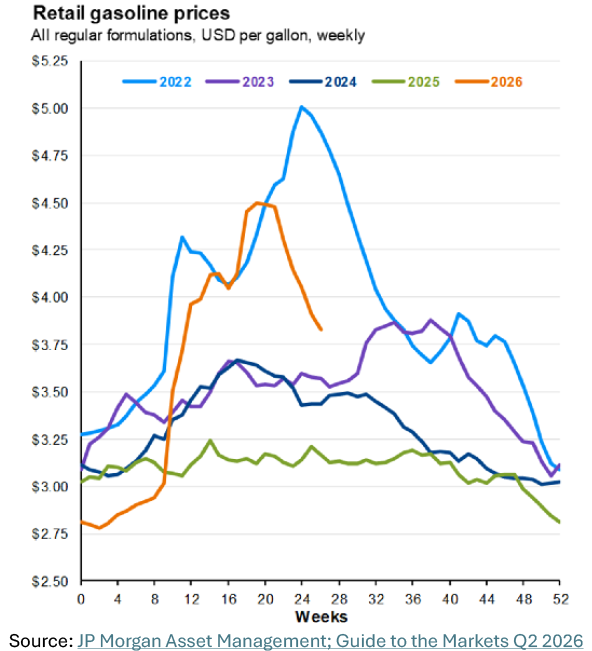
In late February as the first missiles were launched, markets grappled with what would come next. As is often the case, many sold first and asked questions later. The S&P 500 Index traded approximately 9% lower in a matter of weeks. The price of oil nearly doubled. The national average of gasoline rose by more than 60%. The news cycle was dire. Seemingly everyone became experts on the Strait of Hormuz.
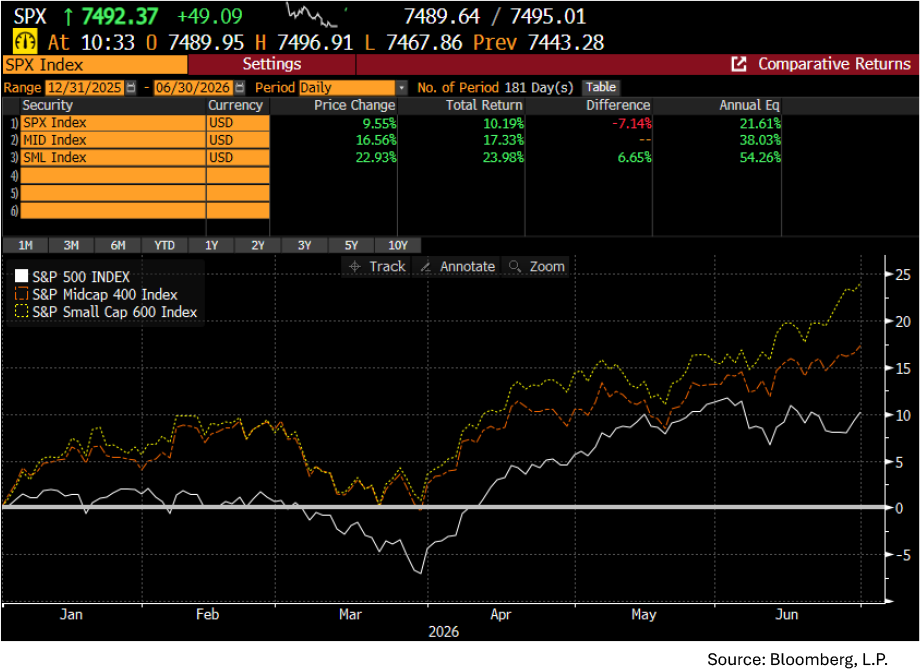
Then without notice, markets did what markets have always done—pivoted when least expected. On March 30th, the S&P 500 Index bottomed and within two weeks the index was back at all-time highs. By early June, the rebound approached +20% from the March lows. The S&P 500 Index total return for the six months ending June 30th was up +10.19%.
Strength wasn’t just experienced in the US, however. MSCI Europe Index and the MSCI World Excluding the US Index were also up +8.26% and +9.63% in US Dollar terms, respectively for the six-month period.
International Continues to Outperform
Before digging deeper into the dynamics here in the US, we’d like to make note of how strong non-US equity markets have been during the last 24 months. In fact, the MSCI World Ex-US, MSCI Europe, MSCI Emerging Markets Index (all in USD terms) have outperformed the tech-heavy S&P 500 Index for the two years ending June 30th, 2026.
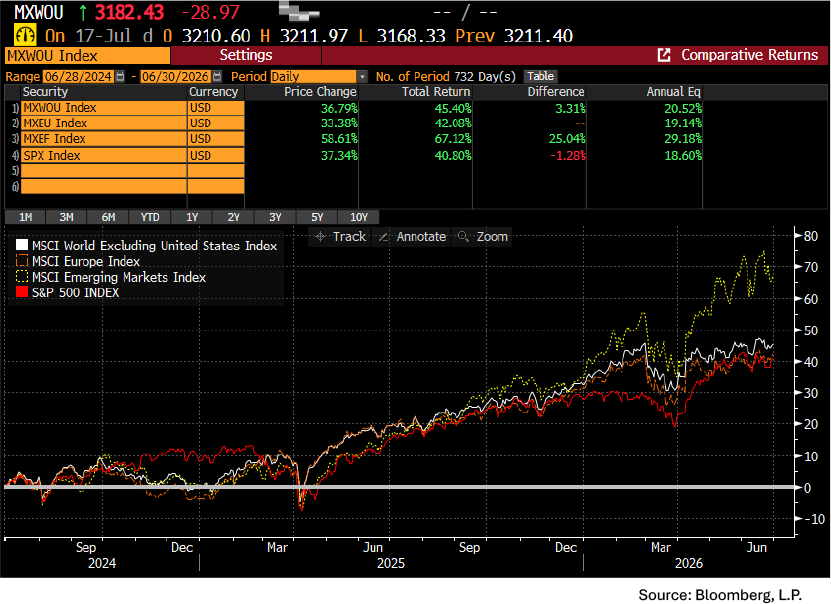
We have been proponents of investing in non-US stocks for many years. For our discretionary clients it was not uncommon for us to allocate 15% or more abroad. Not only does this exposure provide the benefits of diversification, even after accounting for non-US stocks’ outperformance over the last several years, the indexes listed above all trade at valuation discounts and higher dividend yields as compared to the S&P 500 Index.
Mag7 or Lag7?
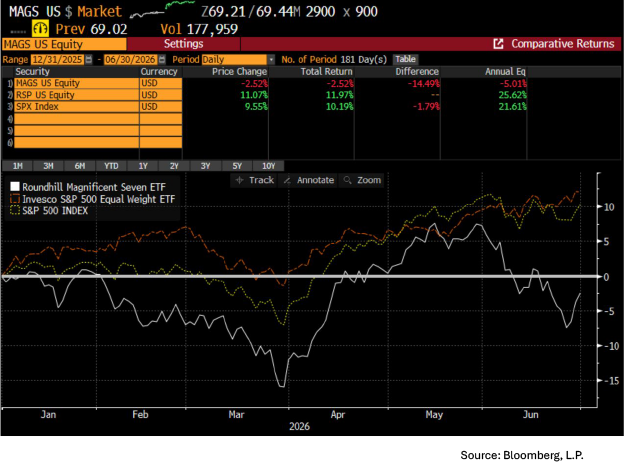
Stateside, when you look further under the hood of the S&P 500 Index, for the first time in many years, positive performance is not being driven by the so-called “Magnificent 7” stocks (Nvidia, Microsoft, Alphabet, Apple, Amazon, Tesla, Meta). In fact, through the first half of 2026, the equal weighted basket of the Mag7 as represented by the Roundhill Mag7 ETF (ticker: MAGS) was down on the year with the remaining 493 constituents of the index being the source of positive returns. Many pundits cautioned that once the Mag7 struggled, the market was doomed to roll over. The opposite has occurred. As you can see below, with the Mag7 down year-to-date, the equal weighted S&P 500 Index ETF (ticker: RSP) is outperforming the market cap weighted S&P 500 Index for the six months ending June 30th, 2026.
Is Smaller Better?
The S&P 500 Index, whose median constituent’s market cap is $44 billion, tracks the 500 largest publicly traded companies in the US. As noted above, 493 of these companies are collectively outpacing the largest 7 (the mega-caps). If you move down the market-cap spectrum to mid-cap and small-cap companies, the theme continues.
The S&P Mid Cap 400 Index (median market cap size of $8.1 billion) and the S&P Small Cap 600 Index (median market cap size of $2.9 billion), both are handily beating their larger counterparts with the small cap index total return more than doubling that of the S&P 500 year to date through June 30th:
With the US at war in the Middle East, inflation resurging and the largest stocks in the world struggling, the strength of global equity markets across most segments and size may be difficult to rationalize. These crosscurrents caused Jamie Dimon, CEO of JP Morgan, to struggle with opposing dynamics on his Q2 earnings release earlier this month.
The U.S. economy has demonstrated notable resiliency this year, with stronger business investment and hiring. This strength is being supported by several tailwinds, including AI-driven capital investment, fiscal stimulus and the benefits of more efficient regulation. However, several risks are shifting below the surface like tectonic plates, including geopolitical tensions and wars, sticky inflation, large global fiscal deficits and elevated asset prices. We cannot predict how these forces will ultimately play out. They may remain manageable, but they could also cause meaningful disruptions when they shift or collide.
Source: JP Morgan Chase- Quarterly Earnings Report (Q2 2026)
If the leader of the nation’s largest bank is struggling with opposing forces, he is not alone.
New Fed Chair
As if war wasn’t enough to rattle an investor’s resolve, Kevin Warsh replaced Jerome Powell as Chairman of the US Federal Reserve in May. Much has been written and said about what a new Chair may mean for rate policy and the implications for the investment environment. As market participants and fiduciaries to our clients’ wealth, we enjoy reading about Fed policy, however, prognostications about whether a new Fed Chair will be “dovish” or “hawkish” will not alter our investment approach.
We do find it interesting, however, that Fed Chair Warsh has signaled less disclosure and reliance on forward looking guidance. Empirically, this makes sense. While bright and well-intentioned, even Fed Governors have no ability to accurately predict the future. So yes, a new Fed Chair will bring with him change but nothing so drastic as to alter our approach.
Focus on Earnings and Economy
The economic landscape in the US (and in most countries abroad) remains strong. Here at home, individual balance sheets continue healthy despite an uptick in inflation. This is clearly depicted by the graph and table from JP Morgan’s Guide to the Market (Q2 2026):
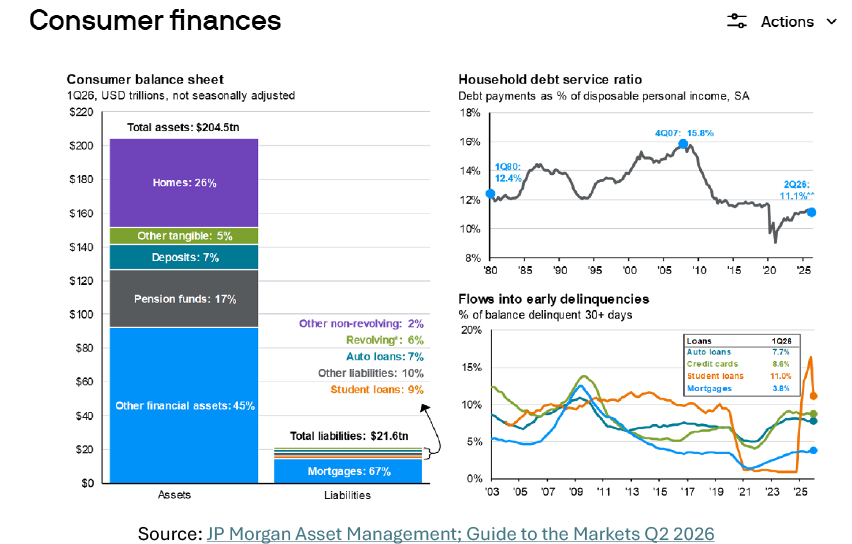
Headlines often highlight the fact that absolute values of consumer debt are at all-time highs, but when you compare these levels with associated assets, it is difficult to describe the consumer as being in a precarious state (left side of the chart). Alone, rising debt levels can be concerning but not if the increases are backed by appreciating assets and by an increase in disposable income (upper right of the chart) to support debt service. By this measure, consumer balance sheets haven’t been this healthy over the last 50 years!
It is true that the price of gas has experienced a shocking rise which eats into consumers’ ability to spend. But consider the chart below of yearly gas prices. We’ve been here before (in 2022), and our nation’s GDP and wages are higher today than when we last paid $4 at the pump.
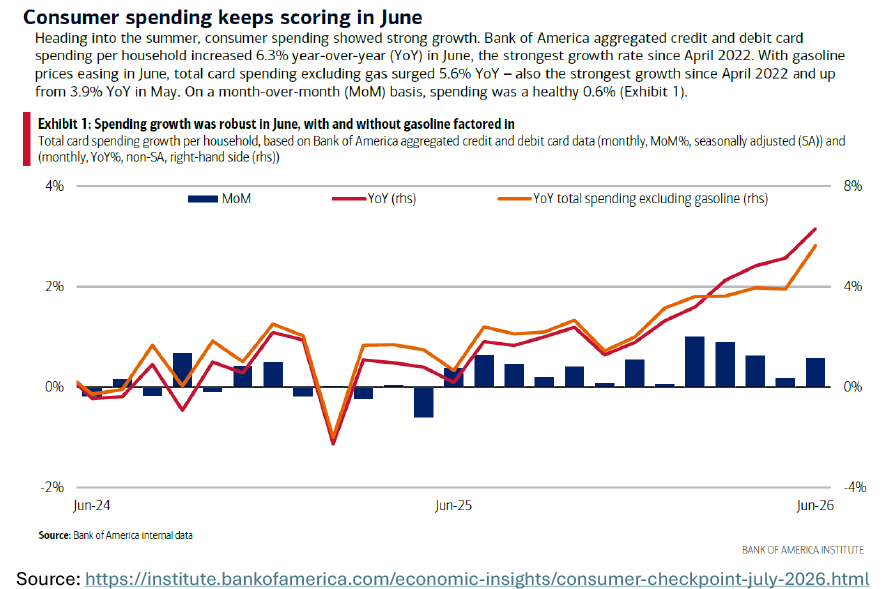
Further cementing the consumer’s resilience is the latest report from the Bank of America Institute. According to their internal credit and debit card data, B of A customers’ spending has increased 6% year-over-year—the largest increase since 2022. We remind you that consumer spending represents roughly two-thirds of the US economy.
Silver and Gold
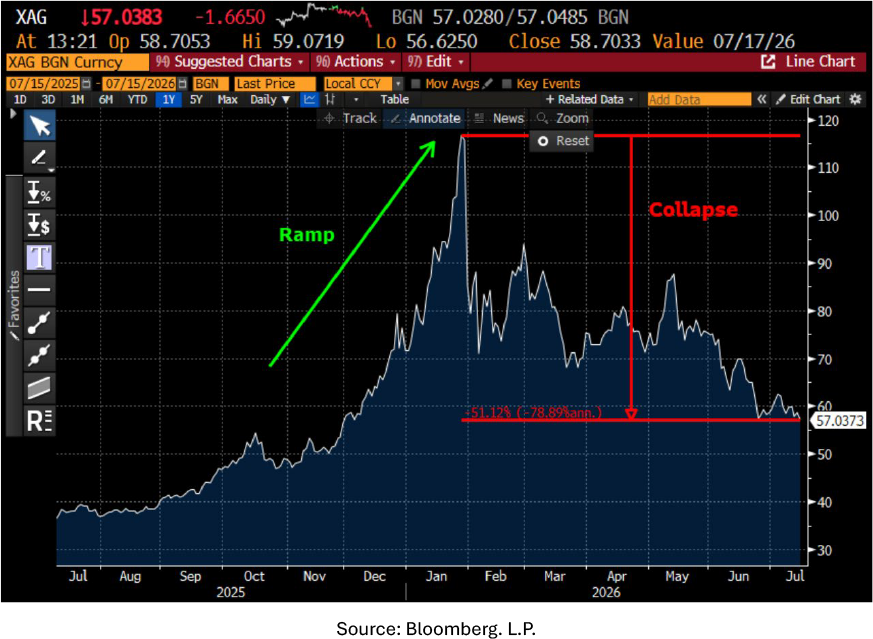
As we entered 2026, spot prices for precious metals were on fire. Gold (GLD) rose +63.68% and silver (SLV) rose +144.66% in 2025. The rise continued during the first part of 2026. But as we wrote about last fall, commodity prices have a history of dropping faster than they rise.
Since their all-time highs earlier this year, gold and silver have experienced drawdowns of more than 25% and 50%, respectively. The calls for adding precious metals to portfolios have subsided as well.
In our view, the recent sell-off has more to do with the overleveraged speculation than anything else. A steep ramp up in price like the one depicted for silver below, is often met with a collapse regardless of security.
What About Bonds?
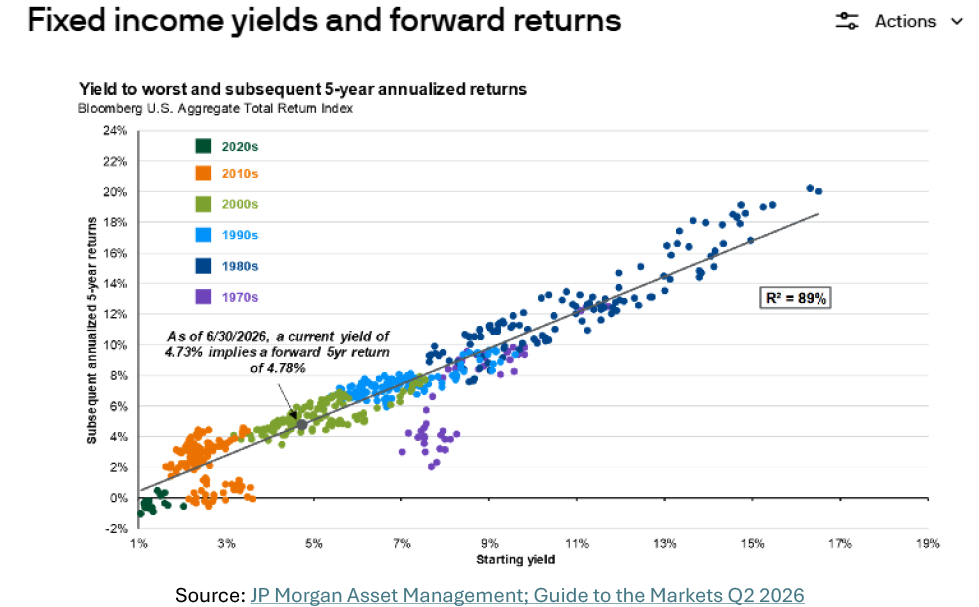
A fixed income portfolio manager at a well-known asset manager recently told us, “You tell me your starting coupon and I will tell you how your fixed income portfolio performed 5 years from now.” Indeed, historical data supports this notion and is clearly depicted by the JP Morgan slide below:
Over the last 10+ years, we have largely been avoiding longer duration fixed income securities for discretionary clients. Long before Covid and the rising interest rate environment that came after the pandemic, we were concerned about inflation eating into the income derived from bond allocations. In practice, that resulted in our focus on floating rate bonds and loans for our clients’ fixed income sleeve.
As global interest rates have continued higher, so too do the potential forward looking returns of fixed rate bonds. As the chart above demonstrates, with a current yield of 4.97% for the Bloomberg US Aggregate Bond Index (as of the date of this report), an investor could anticipate a very similar annualized return for the next five years. No guarantees of course, but assuming an allocation to a seasoned bond manager who avoids outsized defaults, traditional fixed income securities are starting to look more attractive to us.
SpaceX, OpenAI, and Anthropic
We could not summarize the first half of 2026 without covering the IPOs of SpaceX, OpenAI, and Anthropic. That of SpaceX has already occurred. OpenAI has been reportedly delayed. Anthropic is on track for an IPO in the back half of 2026. Due to the uncertainty of timing and size of the latter two, we’d like to focus on SpaceX.
First, as an independent firm, we maintain several custodial and banking relationships. Our three largest being Citibank, JP Morgan, and Charles Schwab. Each sent their process for us to request shares of SpaceX at the pre-IPO set price. On the basis of our internal analysis we declined to request any shares for discretionary clients.
Predicting price movements of stocks in the short-term is impossible. Even more difficult is predicting the price movements post IPO—especially for those as hyped as SpaceX.
Shares were priced at $135 by Elon Musk and not by the traditional and more rigorous “road show” pricing process where investment banks provide company metrics to investors and seek feedback on price. Eventually, market forces dictate price. Not so for SpaceX.
The investors who requested shares received an allocation at the Elon Musk chosen pre-IPO price of $135. On the first day of trading, shares opened around $150. In less than a week, the price of SpaceX touched $225. Several of our clients, understandably, were curious why we hadn’t gotten in on the action on their behalf.
We didn’t because the shares were priced at sky-high levels (pun intended) and not based on any conventional valuation methods. We’ve also been around long enough to have experienced price action of other large, hyped IPOs. The reality is that while price gains can be impressive in the days/weeks after the public offering, the patient investor can almost always acquire shares at lower prices well after the IPO date. Take the chart below from Truist Bank’s Keith Lerner. It depicts 30 of the largest IPOs and their respective price action at various intervals post IPO.
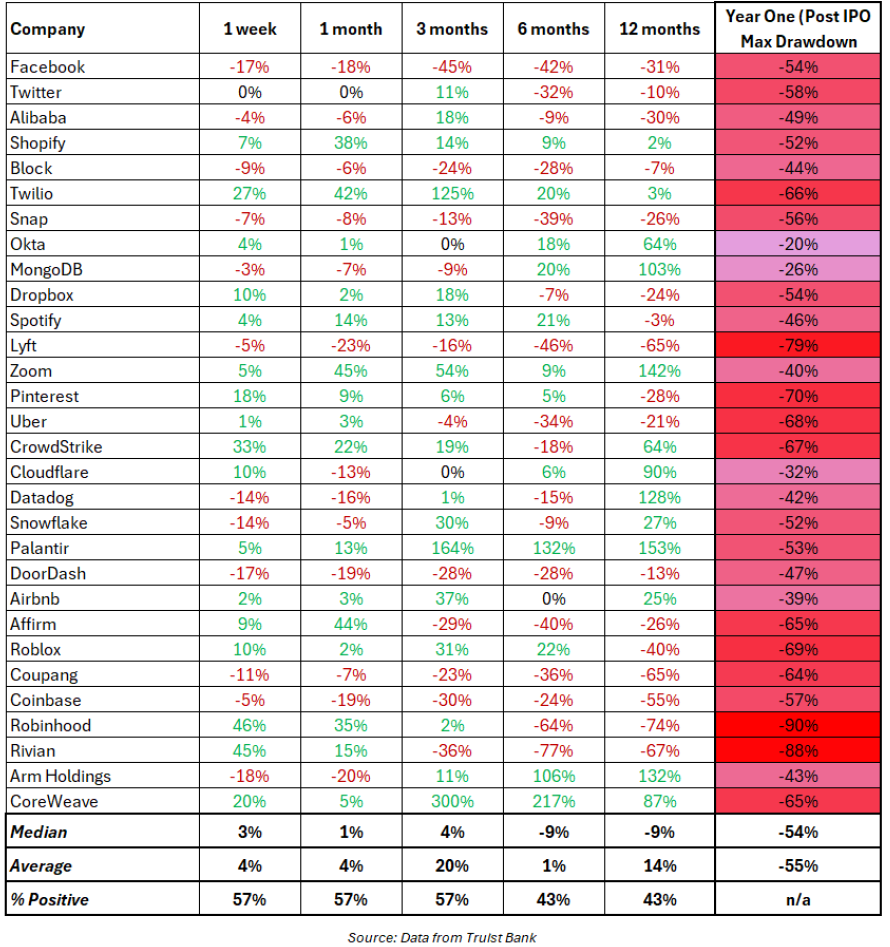
Most interesting to us is the last column. It lists the largest percentage drawdown shares experienced in the first 12 months of trading. The average drawdown for these 30 stocks was 55%!
So, what have SpaceX shares done in the first month or so of trading? After hitting an all-time high of $225 in mid-June, as of the date of this report, shares are now trading at approximately $110 per share—a roughly -50% drawdown from the peak.
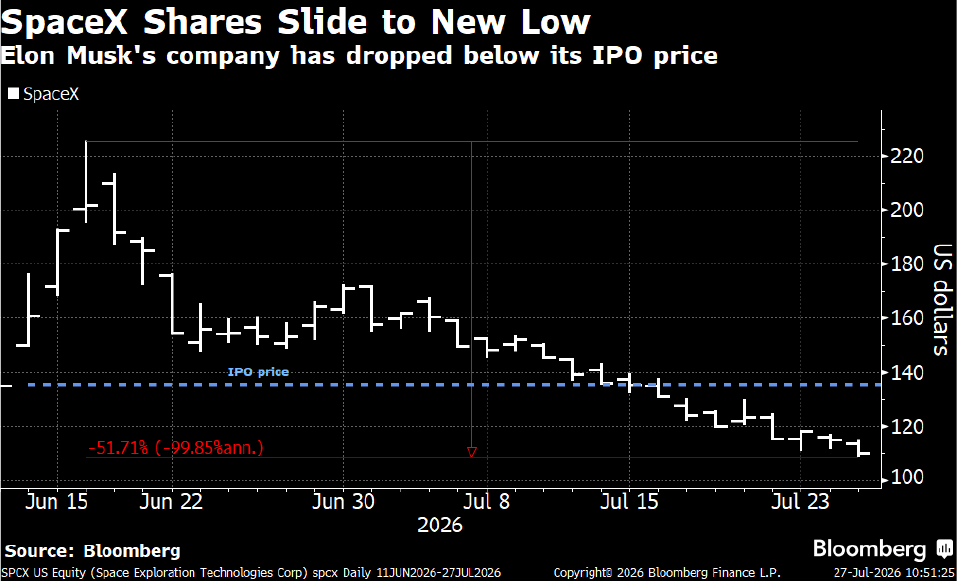
Note that shares now trade below Elon’s demand of $135 per share pre-IPO. This on only 3% of the shares outstanding. Buyer beware today, as significantly more shares will be available for sale as lockups expire in the coming months.
AI
Part of the allure for SpaceX shares is Elon Musk’s claim that the company will spearhead the establishment of data centers in space to power the buildout and execution of Artificial Intelligence.
It has been an exciting development to follow. Through capital expenditures and expected productivity gains, the US economy and by extension its equity markets have benefited from AI. There has been growing concern, however, about the negative side of the enormous AI expenditures. Data centers require large scale real estate, need high levels of energy and abundant water resources to cool the facilities. If AI lives up to its lofty expectations it may also replace jobs. The build-out is still in its infancy, but with each earnings season there is some evidence that AI is beginning to improve profit margins.
See the following chart from JP Morgan:
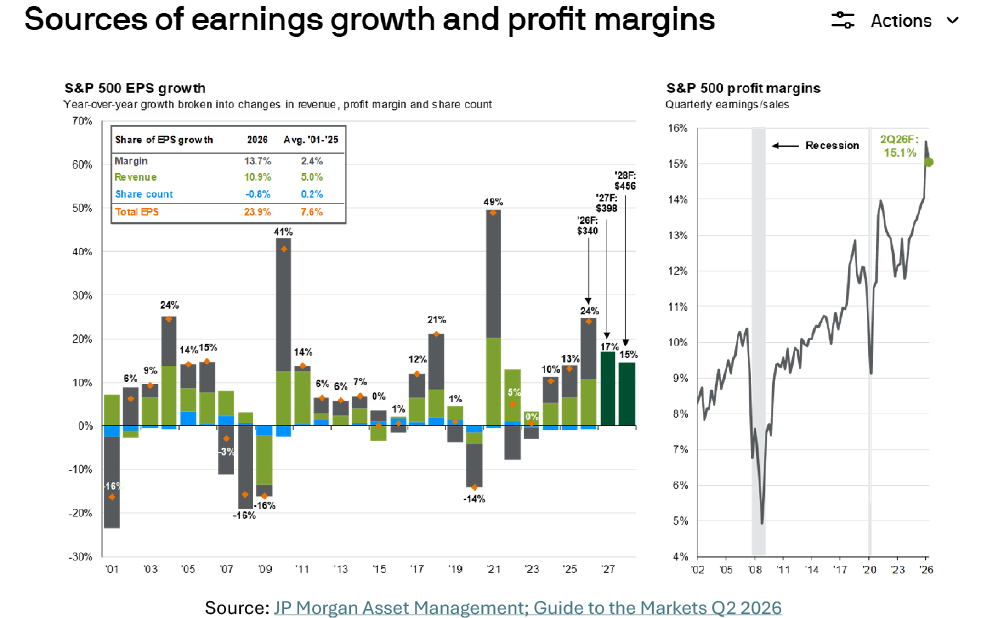
After growing 10% in 2025 and a further 13% in 2025, earnings per share for the S&P 500 Index companies are expected to grow 24% in calendar 2026 then a further 17% and 15% through 2028 (nothing guaranteed of course).
The above chart depicts the profit margins for the S&P 500 Index. After reaching an all-time high to end 2026, capital expenditures from the hyperscalers to build data centers likely caused the minor drop (capital expenditures eat into margins). At the same time, there is evidence that the increased profit margins are in part a reflection of accounting for the enormous increase in mark-to-market value of the investments in some of the AI companies, such as Anthropic, Even accounting for that margins are still sitting far above the previous highs coming out of Covid. Productivity and earnings increases generally are supportive of equity prices. Perhaps the stock market gains of the last several years are justified.
Indeed, AI certainly will disrupt the labor markets just as major technological breakthroughs have done throughout history (railroads, automobiles, calculators, computers, cell phones and the internet as examples). We will likely overdevelop this technological development but not at the expense of our economy overall. If history is any guide, the economy will be disrupted, but it will adapt and continue to grow.
Industries unknown to us today will dominate in the decades to come. Today, the top engineers coming out of Stanford and MIT are fetching contracts that would make an NBA All-Stars’ jealous. The job titles that they are being hired for didn’t exist 30 years ago.
Investing at All-Time Highs
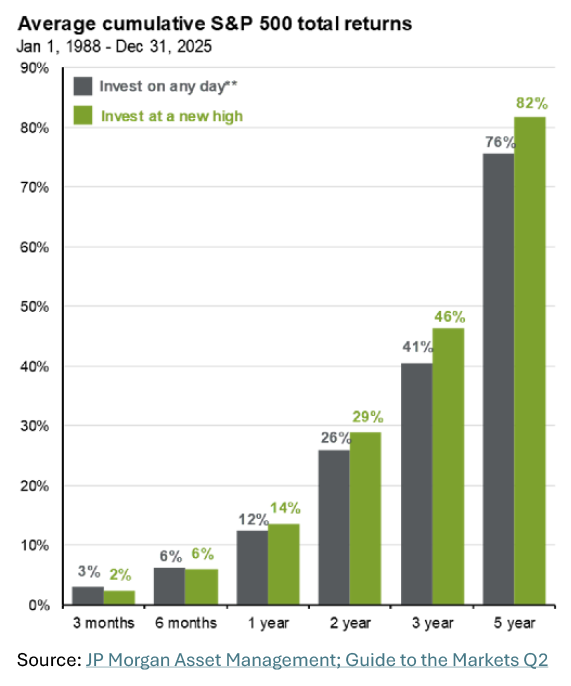 If you agree with Jamie Dimon’s comments, the economic landscape is certainly mixed. There is plenty to be optimistic about but as always, risks are present. We are often asked whether it makes sense to invest more capital when we sit at or near all-time market index highs. While it may make intuitive sense to wait for a pull-back, for a long-term investor, the data suggests otherwise. It turns out that if you plan to hold for 6 months or more, forward returns are better when investing at all-time highs (green), compared to investing on any other day.
We would truly caution against allowing trepidation to rob your future self of the wealth-building that a proper investment plan can create.
Conclusion
Thus far in 2026 it has been a wild ride but patience and sticking to one’s investment game plan has been rewarded—especially regarding equities. The current climate brings us both dangers (wars, geopolitics, potential labor displacement) as well as opportunities (IPO frenzy, AI build-out issues, equity markets valuations). Conflicting signals, however, have always been and will always be at the center of an investor’s decision making.
On balance, however, for investors who think in terms of years and decades rather than days or weeks, equities continue to offer a reasonable chance to outpace inflation. No guarantees of course, as evidenced by the volatility during the last two years. Expect to be tested. There’s no free lunch.
If conflicting signals are causing you to second guess your plan, give us a call or shoot us an email.
You will be greeted by a fellow human to help bring comfort and execute on the plan that best suits your objectives.
Thank you for your continued trust and confidence.
Sincerely,
The CastleKeep Team
July 27, 2026
PDF version of this post: 2025 Semi-Annual Review