


CKBlog: The Market
Wednesday, January 28, 2026
2025 Market Review: Positive Momentum Carries On
by The CastleKeep Team
Stocks delivered again. After the 2022 sell-off when the S&P 500 dropped by 18.12%, it has now rebounded 26.26% in 2023, 25.00% in 2024, and another 17.86% this past year. In fact, the 500 largest companies that comprise the S&P 500 have nearly doubled off from their 2022 lows. It wasn’t just the S&P 500. The rebound and rally were broad-based and global. Have a look at the 2025 returns for major indexes across asset classes below.
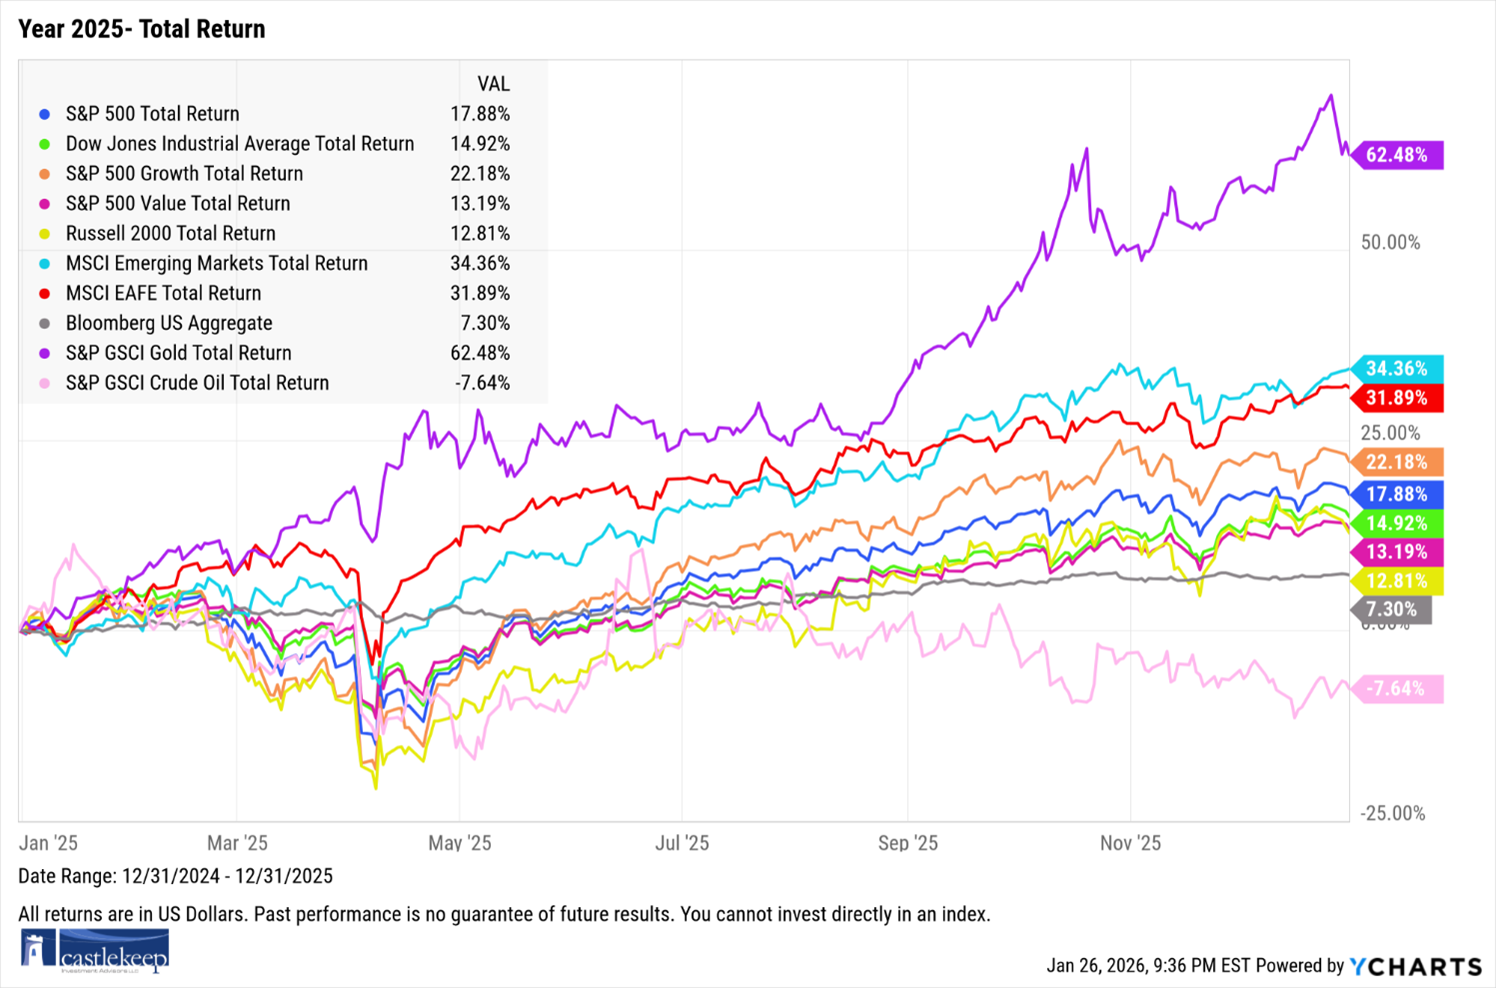
Similar trends were observed on a sector basis within the S&P 500 Index in the following graph.
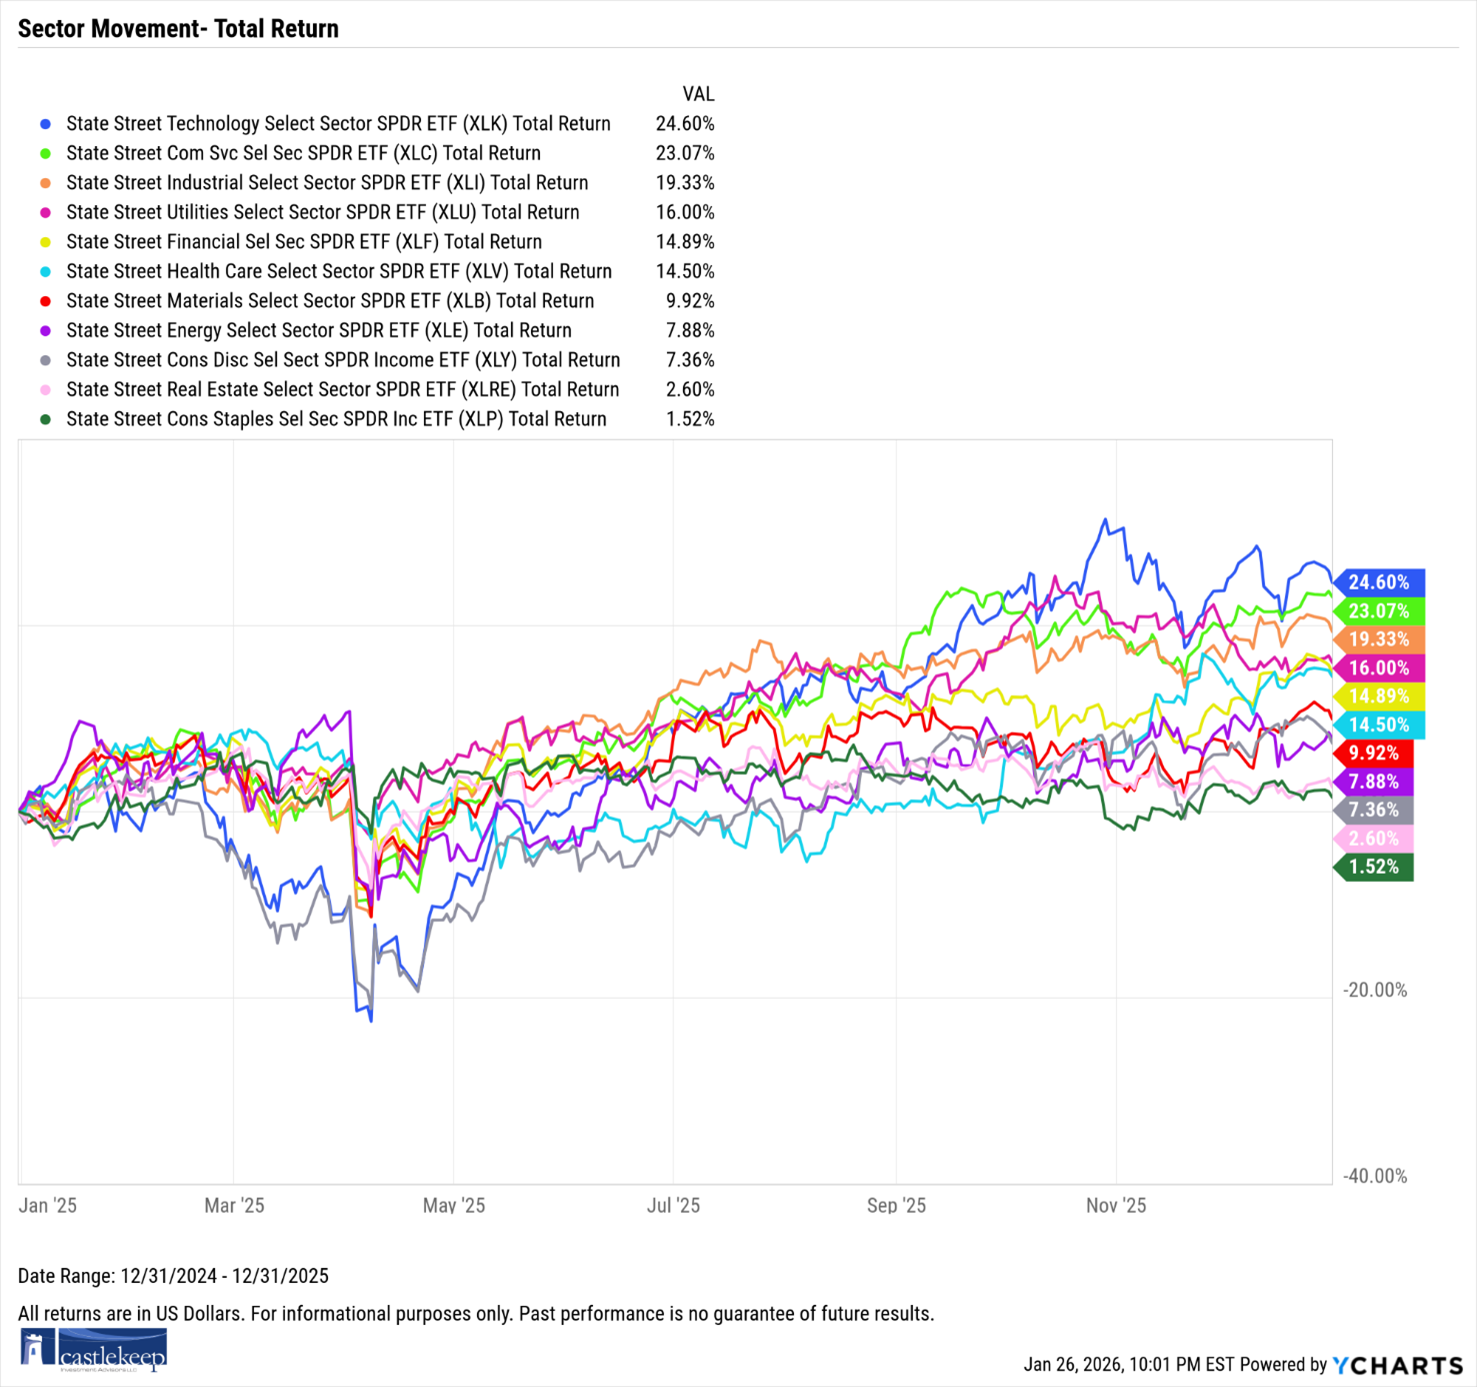
One question may come to mind: is this streak irrational? In the long run, stock prices should reflect the earnings of the businesses they track. Earnings per share (profits) for the S&P 500 companies in aggregate have grown by double digits in each of the last two years. Consensus estimates (not guaranteed) call for double-digit growth to continue in both 2026 and 2027. US companies have never been more profitable and expectations for growth remain.
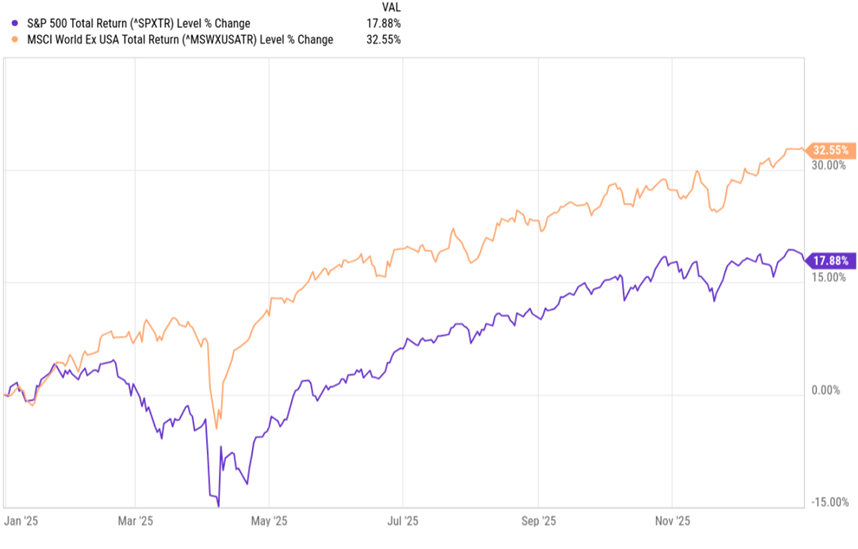
It wasn’t just US stocks that delivered impressive returns in 2025, however. In fact, US with a “home country bias” were probably surprised that US stocks actually underperformed the rest of the world in aggregate. The next chart tells the story as it plots the performance of the S&P 500 Index (representing the US equity market) versus the MSCI World Ex-US Index to represent the rest of the world in 2025, all data in US Dollar terms:
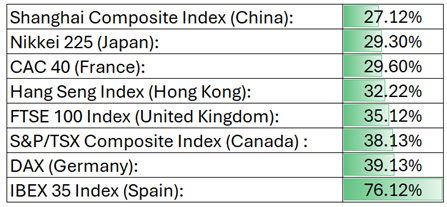
To drive the point further, here’s a sampling of some of the major global equity index total returns for 2025 (all are in US Dollar terms):
Many pundits believe the strength of the US markets is centered on Artificial Intelligence (AI). They have claimed that investors require exposure to technology stocks for strong returns. If that were true, how would you explain the returns posted in Europe in 2025, a region known for industrial manufacturing, fashion, and service industries such as banking? With a 36.30% total return, the MSCI Europe Index more than doubled the return of the S&P 500 Index in US Dollar terms (it was up 20.20% in Euro terms). The region certainly is not known for its breakthroughs in AI or technology.
You might be surprised to learn that the MSCI European Bank Index has tripled the performance of the technology heavy NASDAQ 100 Index over the last five years (in USD terms):
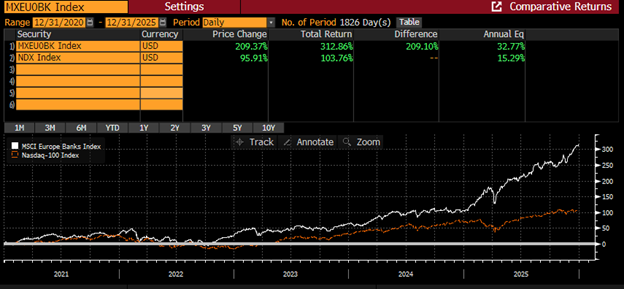
Source: Bloomberg, L.P.
Diversification Worked
In what feels like the first time in many years, globally diversified portfolios experienced excellent relative returns. But it wasn’t just global stocks supporting these diversified returns. In fact, and in a rare occurrence, precious and industrial metals (commodities) experienced a surge. Here are the 2025 returns for a few of the major metals:
Gold: +64.58% Silver: +147.95% Copper: +36.46% Platinum: +116.20%
What is driving these returns? Is it a renewed concern about inflation? Higher demand due to the AI construction boom? Speculation? FOMO? Political instability?
Some of our thoughts on the commodity complex were included in our note about Silver published last October:CKIA Blog: It Took Silver 45 Years to Recover.
Lessons from the Tariff Tantrum
2025 was an instructive year to evaluate investor behavior. What seems like ages ago but was only this past spring, the tariff tantrum that spooked the markets caused the S&P 500 Index a max closing drawdown of 18.9%. Market action, investor sentiment, and political rhetoric led to extreme uncertainty and made for the perfect storm.
We didn’t know when, but were confident that stocks would come back. They always have. We encouraged concerned clients to stay the course and reminded them of the market history. The Great Depression, Pearl Harbor, World Wars, 1970s Inflation, Black Monday, Dotcom Bubble, the Financial Crisis, and Global Pandemics were all reasons for investors to consider seeking shelter outside of stocks. Each of those periods, with the benefit of hindsight of course, occurred many market multiples lower than where the stock market trades today.
Consider the investor with unfortunate market timing who bought the S&P 500 Index at its high just before the collapse of the 2008 Financial Crisis. That investor would have bought in at 1430 and devastatingly rode the index down to 666. While pundits recommended to sell, history (and CastleKeep) would have guided the investor to hang on. Turns out, history won. The S&P 500 Index has grown by more than 10x off the lows of 2009.
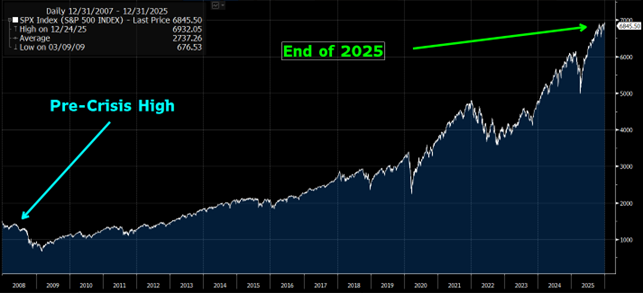
Source: Bloomberg, L.P.
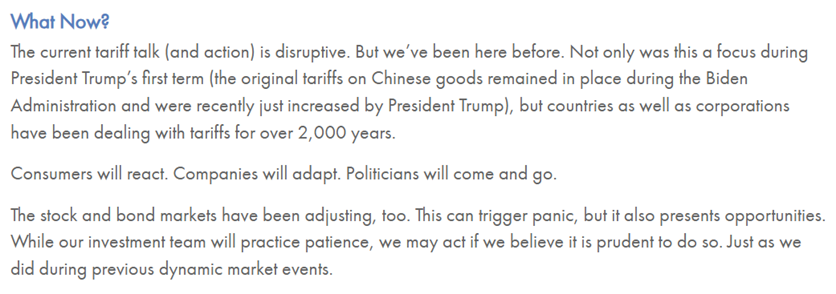
Which is why we view these acute sell-offs as opportunities to add to positions on our watch list. We wrote about our approach during the tariff tantrum sell-off in the spring and wanted to share a quick reminder [CKIA Blog- Tariffs and Markets]:
Under the Hood of the Mag 7 Stocks
The Magnificent 7 have never had larger exposure within the S&P 500, yet their contribution to performance seems to be diminishing. Last year, these seven stocks contributed less to the index gains compared to the remaining 493 companies in the S&P 500. In fact, only two of the Mag 7 stocks beat the index last year (Alphabet and Nvidia). The Mag 7 impact to contribution, while still meaningful, has decreased in each of the last three years. A trend that has continued this year, albeit only a couple weeks of trading so far. Is this trend here to stay? The following chart depicts their waning impact (courtesy of Carson Wealth):
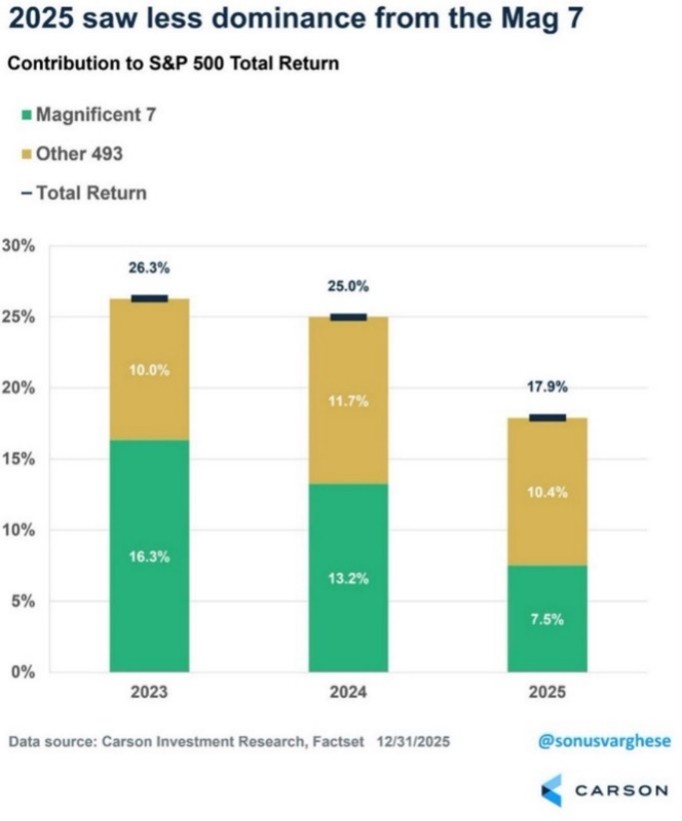
Carson Group; 2026 Market Outlook
Economy
The rise of the 493 may be less about the Mag 7 and more to do with strong fundamentals within the US economy. While the Mag 7 stocks are generally considered part of the technology sector, the rest of the S&P 500 Index is represented by companies in a variety of other sectors. Strong economic conditions will be supportive of most industries.
Inflation is relatively benign (under 3%), folks are paying less at the pump (less than $3/gallon for the current national unleaded average), short-term interest rates have been driven lower by the Fed (potentially positive impact to mortgage and auto loans) and the latest report of US GDP depicted that the economy grew at an annualized real rate of 4.3%. Recall that the real rate strips away the effect of inflation and therefore in nominal terms our economy grew at an annualized rate north of 7%! The following chart depicts quarterly GDP data from the US Bureau of Economic Analysis:
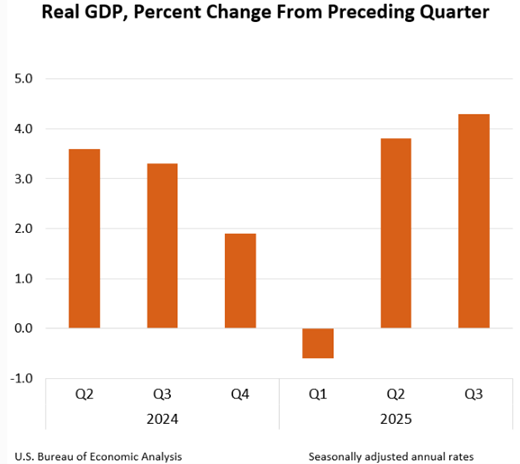
US Bureau of Economic Analysis; GDP Data
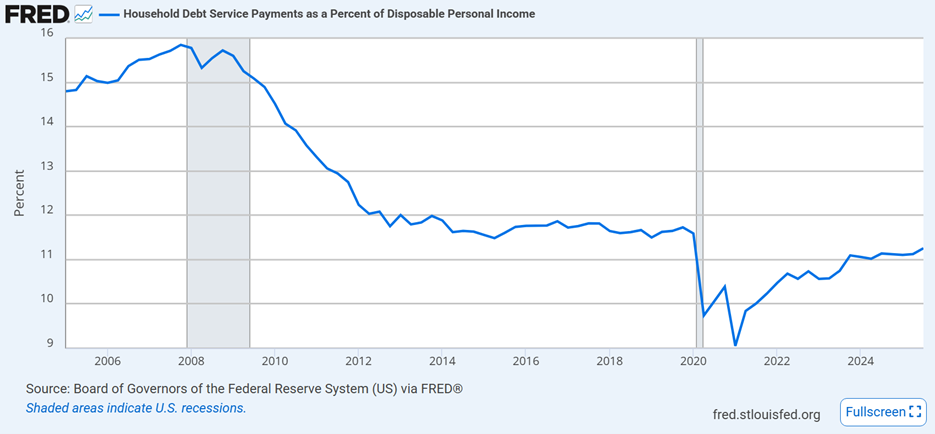
Yes, it is true that the build out of Artificial Intelligence has provided some economic support, but the US economy is still driven by consumption (roughly 70% of GDP). Americans love to spend and their own balance sheets remain strong.
We’ve shared the following graph before. It plots the amount of debt payments US households make as a percentage of their income. While the very recent trend is higher, current levels remain at multi-year lows and below the pre-pandemic trend.
Buffett Retires
Our clients have been long-time shareholders of Berkshire Hathaway, several of whom have held the stock for 30+ years. At times, Berkshire has been the largest single stock holding in our discretionary portfolios. Warren Buffett has not only reinforced successful investing principles, but he has also had a direct impact to many of our clients’ results.
It’s no secret Mr. Buffett’s retirement was forthcoming. After all, he’s 95! His formal announcement, however, came as a surprise to investors (and his Board) at the Berkshire Hathaway Annual Shareholder Meeting on May 3rd.
The stock sold off by some 15% in the weeks after his announcement which was not surprising to us. Afterall, the greatest investor of our lifetime was stepping aside.
The stock rebounded off of its May 2025 lows and posted a 10.85% return on the year. This is also not surprising to us. The company’s balance sheet is solid with operating earnings growth in the double digits. Berkshire is also sitting on more than $350 billion in US Treasury Bills. It is a less expensive and very efficient proxy to gain exposure to the US economy (and increasingly Japan’s). It is now led by Greg Abel, former Vice Chair and executive with 25 years under his belt at Berkshire. While our current plan is to hold the stock for discretionary clients, Warren Buffett’s formal leadership role will be missed. We will leave you with our favorite statistic to demonstrate The Oracle of Omaha’s extraordinary run:
If Berkshire Hathaway stock dropped 99% tomorrow, it would still have outperformed the S&P 500 Index during Warren Buffett’s reign as CEO starting in 1965.
The 2026 Watch List
Our annual letter tends to focus on the year prior as it adds perspective to clients’ results. Markets, however, are forward looking and the items below are on our radar.
Small Capitalization Resurgence
Prior to the Financial Crisis in 2008, historical data demonstrated that smaller company stocks, so-called “small caps” outperformed “large caps” over the long term. Small caps, after all, tend to be “younger” companies with more room to grow. This trend was upended post Financial Crisis as investors turned their attention to larger, faster growing technology companies. From December 31st, 2008 through December 31st, 2025, the Russell 2000 Index (representing the US small cap market) returned 11.38% per annum while the S&P 500 Index (skewed to large cap technology) returned 14.79% per annum. Larger companies outperformed smaller companies by more than 3% per year over the 17-year period.
What about the last six months ending January 15th, 2026? The Russell 2000 Index (small caps) are up 22.12% while the S&P 500 Index (large caps) are up 11.88%. Smaller companies tend to perform better in a strong economy with low interest rates. Perhaps this trend is just beginning.
Midterm Elections
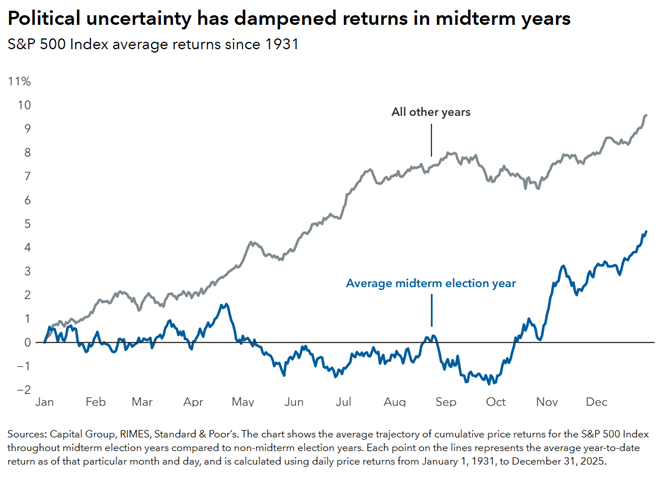
As if our politicians haven’t given us enough (or too much?) to worry about, 2026 brings us the midterm congressional elections. The headlines are just heating up. Midterm election years are historically more volatile and typically deliver lower returns than non-election years (noting that these “lower” are still positive). As time goes on, the markets will be increasingly focused on the 2027 composition of Congress. The chart below depicts the historical trends, courtesy of the Capital Group.
At the risk of sounding like a broken record, however, staying the course should offset these political headwinds. Take a look at the historical returns for the year following mid-term elections, also provided by the Capital Group.
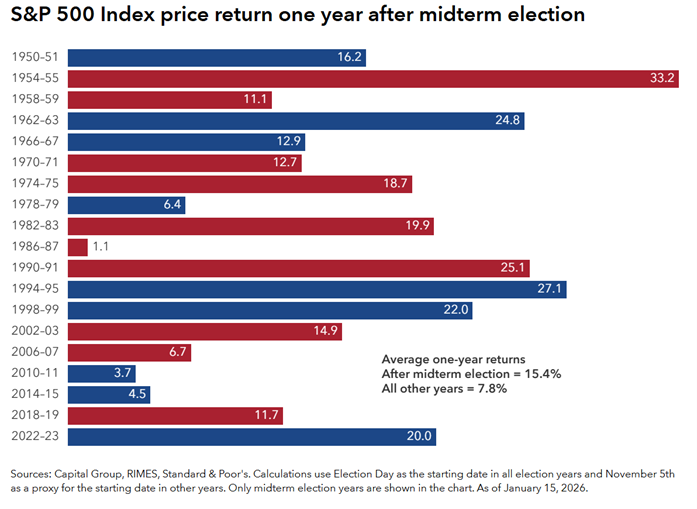
Hang on.
While top of mind, small caps and midterms certainly aren’t the only themes that have attracted our attention. The beauty, or rather, the challenge, of operating in financial markets is that dynamics are constantly changing. Markets are forward-looking. As advisors and fiduciaries to our clients, we look forward to navigating the inevitable uncertainties while uncovering opportunities in this ever-changing world.
Conclusion
2025 was a very special year for CastleKeep. It was our 25th anniversary, which we celebrated in June. We reaffirmed our personal and financial commitment to specific local charities as well as our commitment to find a cure for ALS. We also finished the year with record assets under management thanks to our clients and healthy returns in the markets.
Thank you for your continued trust and confidence.
Sincerely,
The CastleKeep Team
January 27, 2026
PDF Copy of 2025 Market Review: Positive Momentum Carries On