


CKBlog: The Market
Wednesday, January 20, 2021
2020 Year in Review
by The CastleKeep Team
Everything happened in 2020. To start the year, the US stock market hit all-time highs. It then hit three-year lows (in less than 30 trading days). We had a correction, then a bear market as the S&P 500 Index dropped 34%. We went into recession, the steepest quarterly GDP decline in decades. We then recovered, experiencing the sharpest recovery in decades.
The unemployment rate hit 13% in April, a level not seen since the Great Depression. In one month the US lost more than 20 million jobs. In another, we gained nearly 5 million jobs. The price per barrel of oil went negative then recovered to over $40 by year end. The Federal Reserve injected record amounts of liquidity into the financial markets. Between the Fed and fiscal stimulus, trillions of dollars were added to the economy. And while millions of Americans lost their jobs and thousands lost their life savings, many banks reported that checking account balances hit all-time highs and credit card balances hit multi-year lows.
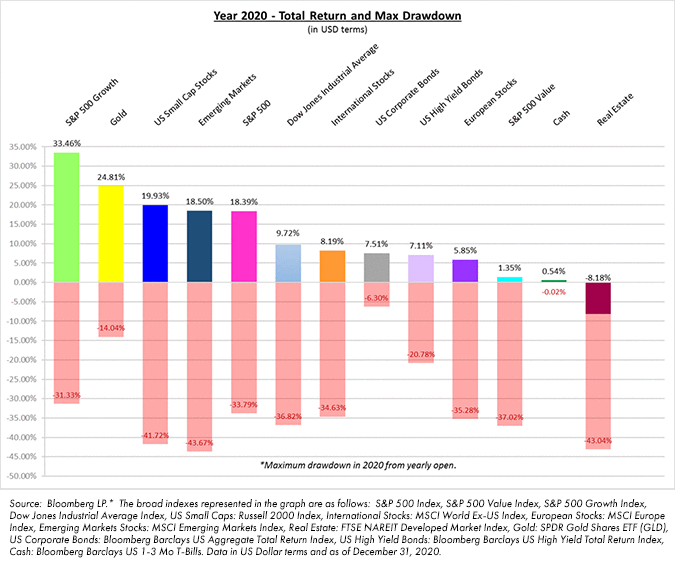
If you were confused in 2020, you weren’t alone. In the end, it was a positive year for nearly every major asset class but not without devastating drawdowns as you can see in the graph below.
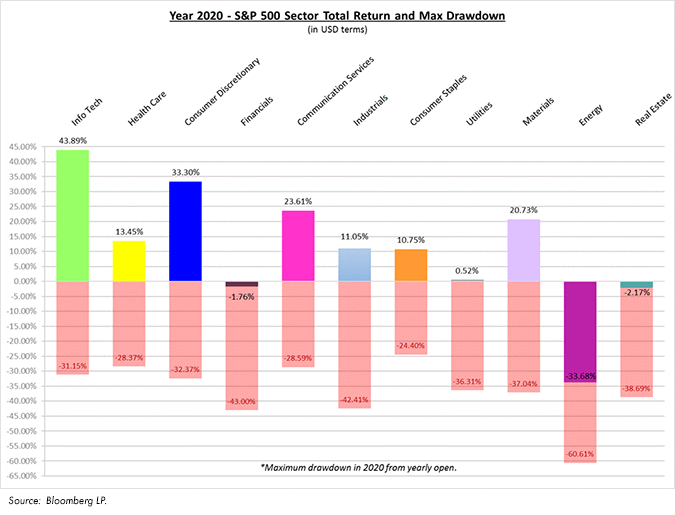
Severe drawdowns and subsequent recoveries also occurred at the sector level within the S&P 500 Index as depicted below.
Turns out that when everything happens at once, doing nothing might be your best strategy.
Stay the Course
Staying the course was a winning strategy in 2020 while literally everything thrown at investors was telling you to do the opposite.
Our clients weren’t immune to the confusion and fear and neither were we. In March, we described our job as competing in the Super Bowl ... every day. Some days started at 4am. Many nights ended after midnight. We had to be there for our clients. This was our Super Bowl.
Never has it been more valuable to have a plan and have trusted advisors to share ideas and fears with. Without one, how on earth could you justify holding investments when the world was on lockdown?
By no means are we out of the proverbial woods. But many are asking with so much uncertainty, sickness, fear, and death; with so many businesses struggling or now out of business, how could so many stocks be trading at all-time highs? It’s a worthy question and we’ll offer several explanations.
Rates are at All-time Lows
And are expected to remain there. The chart below depicts the Fed Funds rate since 1999 and projects potential rate moves in the near future (hint: no major changes).
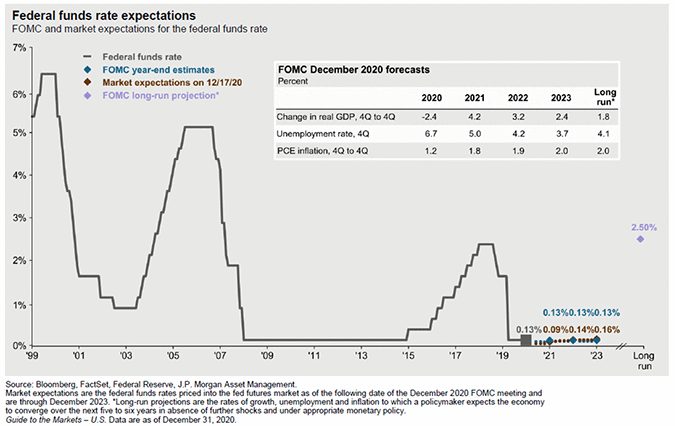
With rates so low, investors earn very little on cash and bonds. The typical savings account pays less than one quarter of one percent in interest per annum. You would earn less than $50 per year on a $10,000 balance. Bonds don’t pay much more. A 10-year US Treasury note ended the year yielding less than one percent per annum. The paltry rates make investors more willing to take the risk of buying stocks. Sure, cash and bonds come with more certainty of principal than stocks, but many investors question why they should earn less than one percent when they can own higher quality stocks that have dividend yields north of 2%.
When the Federal Reserve sets rates at all-time lows, it also means that it costs less for individuals and corporations to borrow money. Based on data from Bloomberg/Bankrate, the average conventional 30-year fixed rate mortgage was about 3.85% per annum to start 2020. It fell to about 2.85% by the end of the year—a savings of $1,250 per month for a $500,000 mortgage! If we are collectively spending less of our income servicing debt, we have more money to spend (or invest) and support the economy.
Revolving Credit at Multi-Year Lows
With so many folks out of work, it may come as a surprise that revolving credit balances (i.e. credit card debt) is at a multi-year low. Wait, really? The below depicts the outstanding amount of credit card balances in the US going back five years, courtesy of the St. Louis Federal Reserve Bank:
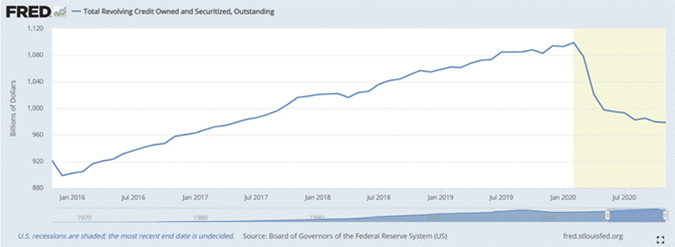
It’s true: fiscal stimulus and extra unemployment benefits are working. Between the two, and not including President Biden’s proposed $2 trillion package, over $3 trillion has been injected into the US economy, representing roughly 13% of the US GDP according to publications by Statista. For comparison sake, the Financial Crisis rescue packages totaled $800 million.
In general, Americans have been using these checks to pay down debt and increase savings. With their balance sheets in better shape, a healthier job market and more vaccinations anticipated, households are more likely to take the risk of buying that new car, new house, or invest more in the market.
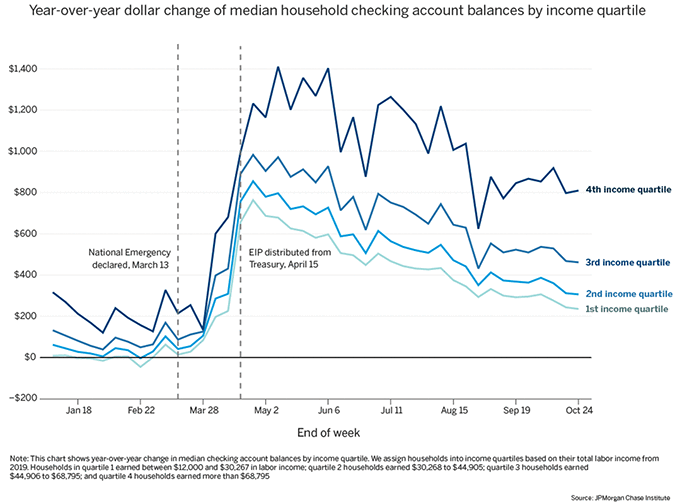
Even the lowest income quartile had more cash in their checking accounts to end the year than when 2020 started according to the J.P. Morgan Chase Institute, which publishes banking data. Check out the following chart:
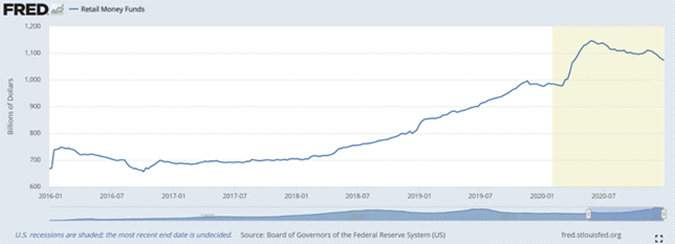
Checking and savings account balances have spilled over into brokerage accounts. Again, from the St. Louis Federal Reserve Bank, Americans hold a record amount in money market funds—the default cash option for retail investors’ brokerage accounts.
The same is true for institutional investors ...
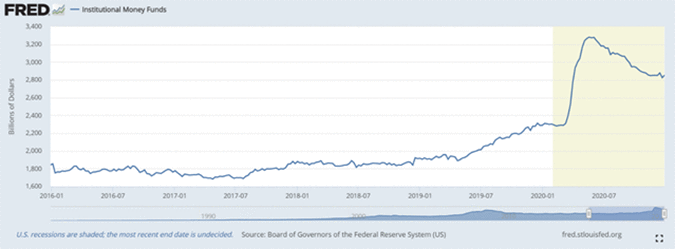
Higher amounts of cash in retail and institutional brokerage accounts may signal that investors are reluctant to invest in risk assets or spend for consumer goods, but it also means there is a record amount of dry powder that when deployed will propel stocks (and other risk assets) even higher.
A New Government
Remember the concern surrounding the US Presidential and Congressional elections? The S&P 500, MSCI World and Russell 2000 indexes were up more than 7%, 9%, and 20% respectively, from November 6 through the end of the year. As it turned out, the concern surrounding the Democrats sweeping control of the House, Senate, and Presidency was unwarranted. Why?
A reasonable explanation (with the benefit of hindsight) may be that Democrats have signaled larger stimulus checks and COVID-19 relief packages than the Trump Administration (while the Senate was controlled by Republicans). And yes, it’s true that Democrats tend to favor higher taxes and regulation. However, given that the Senate seats are now divided 50-50 (with Vice President Harris representing the tie breaking vote), drastic reforms seem less likely. Left-leaning policies will need to shift towards the center to be enacted into law. Investors are rejoicing.
US GDP Set to Surge
Maybe the “experts” will be wrong—if 2020 taught us anything, it’s that predicting the future is anyone’s guess—but most investors and economists would be surprised if we didn’t experience a strong recovery coming out of lockdown. A strengthening global economy is good for business. And what’s good for business is generally good for stock markets. But is that recovery priced into these all-time highs? Aren’t there reasons to be cautious?Concerns on the Horizon
Markets are forward looking. Participants price in collective expectations. So, when the S&P 500 Index surges 18% during the worst pandemic in 100 years, expectations must be strong. At roughly 23 times next year’s earnings (and virtually any other valuation metric), US stocks overall are expensive relative to history. If the vaccine roll-out continues slow, if earnings miss analyst expectations, if the political environment continues hostile, or if the proverbial thing we never saw coming happens, stocks will correct. And they should. Especially the expensive ones.
Frenzy and Froth
Legendary investor Sir John Templeton famously noted, “Bull markets are born in pessimism, grown on skepticism, mature on optimism, and die on euphoria.”
Whether it’s the price of Tesla, Zoom, or Bitcoin, the euphoric anecdotes are all around us.
As of this writing, Tesla trades at a forward price-to-earnings ratio (P/E) over 350 making even the Dotcom Bubble companies jealous. By this measure, it would take 350 years of 2021 Tesla earnings to be paid back the price of Tesla shares today! It’s true similar things were said about Amazon in the past, and Tesla bulls will proclaim that the company’s earnings growth will exceed current expectations ... but 350 years?!
Zoom is likely with us for a long time, after all, it has become a verb. But the stock has quintupled in 2020. Yes, the company doubled their revenue in the last calendar year to $630 million but should that warrant a 500% gain? Zoom now sports a market cap higher than Campbells Soup despite the soup maker earning nearly 15 times the revenue of Zoom in 2020.With Microsoft Teams, Skype, Apple FaceTime, and Google Hangouts, is a forward P/E of 125 justified? Or is Zoom full of froth?
Speaking of froth, what a year for Bitcoin! After dropping north of 50% in March, Bitcoin closed 2020 up more than 400%. We’ll defer to the crypto experts to justify the price moves, but if you are eager to own some digital currency, we’d recommend capping it to a small percentage of your net worth. Even if it eventually replaces physical currency and gold, don’t expect it to be a smooth ride. In the several days it took us to write this letter, the price of a Bitcoin ran up from $30,000 to $41,000 then dropped to $31,000, rose to $40,000, only too finish at $32,000 by publication.
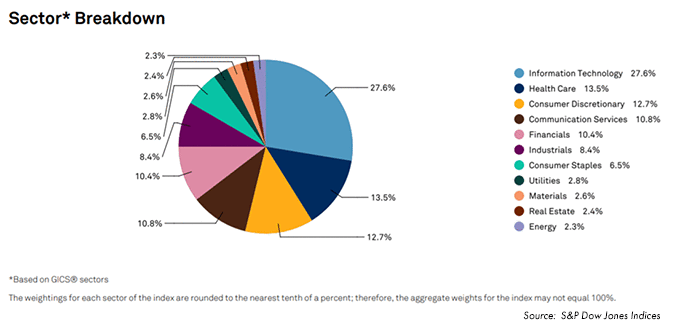
Titanic Tech
As of December 31, 2020, the technology sector represents 27.6% of the S&P 500 Index, approaching the largest sector weighting in the index’s recorded history.
With Tesla’s addition to the index, the six largest constituents at year’s end read Apple, Microsoft, Amazon, Facebook, Tesla, and Alphabet (Google). Think tech will dominate forever? Let’s compare today’s concentration with energy’s dominance within the S&P 500 Index top constituents in 1980 in the following chart:
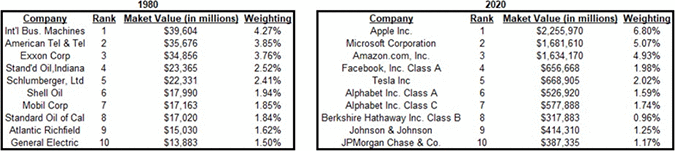
Source: S&P; based on year-end data; Fortune Financial Advisors’ Publication “The Most Concentrated Market in 40 Years”
Technology companies aren’t going anywhere, but rarely does one sector dominate the S&P 500 like it does today. Perhaps tech will, but investors in the 1980’s incorrectly thought energy companies would too. Things change.
What Now?
So, if Sir John Templeton and more than a handful of industry veterans (including Charlie, our CIO) are sensing euphoria, how might that translate into portfolio positioning in today’s environment?
Cash isn’t particularly attractive as a stand-alone asset, but it does play a role in portfolio construction. Think back to March: did you wish you had more cash then? It’s prudent to maintain some dry powder in the event we have a sell-off.
If your risk tolerance calls for exposure to bonds, we recommend shorter maturities or using an active manager that has the expertise and flexibility to mitigate the risks of a rising rate environment. With interest rates at all-time lows and global stimulus at all-time highs, odds are that interest rates will likely move higher.
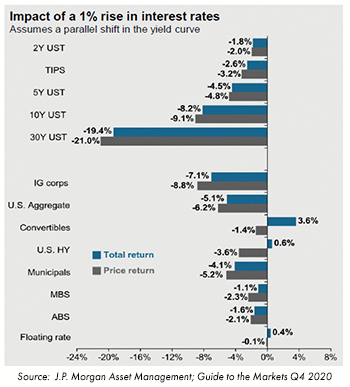 We remind you that bond prices and interest rates have an inverse relationship. When tempted to own longer dated paper, remember the chart to the right.
If interest rates increase by 1%, 30-year bonds will lose roughly 20% of their value. Yes, bond prices can go down so despite how they have been marketed, bonds aren’t always the safest place to “hide out” if you are looking for an alternative to cash. Which brings us to stocks.
Stocks over Cash and Bonds
Largely due to low rates and a recovering global economy, we continue to favor stocks over cash and bonds for investors with time horizons over 3-5 years. But aren’t stocks expensive? True, much of the US stock market is expensive relative to history (and today’s earnings expectations) but there are pockets that haven’t zoomed up like tech. Financials, Industrials, Materials, Energy, and non-Tesla automakers currently trade at multiples lower than the overall market. Attractive value opportunities do in fact exist.
Speaking of value opportunities, yet again, so-called value stocks (S&P 500 Value Index) have never been cheaper relative to growth stocks (NASDAQ Composite Index) as depicted below.
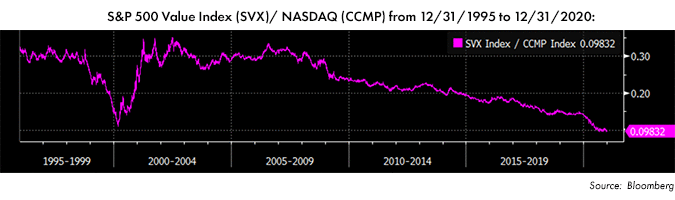
It’s no secret that so-called “growth” stocks have dominated the market for the last decade. With rates so low and growth so scarce, companies that have demonstrated an ability to grow revenue (not necessarily profits) have been rewarded at the expense of established, cyclical slow growers (but cash generators). The S&P 500 Growth index ended 2020 with a forward P/E ratio that is 62% higher than that of the S&P 500 Value index.
So, if part of your investment strategy is to look for less expensive companies, you may find many within the value category. Given the underperformance of these companies over the last 5+ years, it’s understandable if you are reluctant to do so. But, remember, just because the fundamentals of a company screen as value, it doesn’t mean the company cannot grow earnings and perform well.
We recently wrote about Microsoft’s journey from growth to value then back to growth (CastleKeep Blog: Mega tough to play Microsoft). In 2010 investors cautioned the company was stagnant and the “death of PCs” meant Microsoft would be locked into a secular decline. The company, however, was cash flow positive and provided investors a healthy dividend. With a P/E ratio of roughly 15 and the stock trading around $30, Microsoft was a classic “value” stock.
Fast forward to today, Microsoft’s forward P/E has doubled to 30 and the stock now trades over $200 per share—an increase of more than six times. What was once viewed as a value company is now labeled as growth. Same company. Investor sentiment shifted.
Look Abroad and to Emerging Markets
We advise most clients maintain a meaningful allocation to non-US stocks. And for the last several years, non-US stocks have not kept up with their US counterparts—it’s been a drag on relative performance. But something else has happened along the way. As US stocks grew more expensive, non-US stocks have become cheaper.
We’ve shared the chart below on several occasions and updated it through the end of 2020. Using Forward P/E ratios as a valuation metric, non-US and Emerging Markets equities are roughly 30% cheaper than US equities respectively. Want to get paid while waiting for them to recover? Turns out non-US and Emerging Markets equities both sport dividend yields that are also more than 30% higher than their US counterparts.
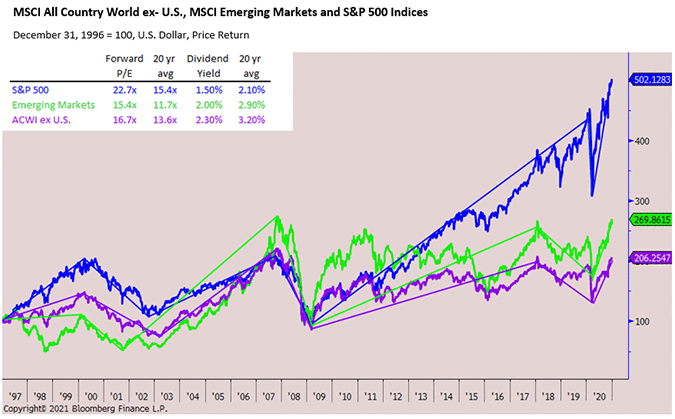
Therefore, by allocating to non-US, you not only gain the benefits of diversification, you are investing in undervalued assets relative to the US and get paid to wait for their recovery. And while Europe, the UK, and Japan have historically been common non-US destinations for investors, we’d also encourage exploring developing market stocks further.
Lower valuations, a weaker US dollar, and faster growing economies point to the emerging interest in emerging market stocks (a recent addition to most of our discretionary portfolios).
Back to Basics
When clients called us in March fearing another Great Depression, they didn’t want to hear whether we liked Tesla or found Swedish stocks undervalued. In crisis, you care less about the profitability of bank stocks and more about whether you have enough in the bank to survive. Often, the secret to building and maintaining wealth has less to do with which stock you bought and more about building a framework to continue to buy and hold that stock for the long term.
So, before you spend too much time deciding between cash, bonds, US, and international stocks, it’s worthwhile to reassess your current situation and affirm your objectives. If you need help with this exercise, give us a call.
A solid foundation will allow you to take advantage of major market dislocations. For most of our discretionary clients, this meant rebalancing or adding to very attractive exposures like bank and non-US stocks in March and April. As it turned out, these same positions were targets for trimming late in the year as their resurgence meant exposures exceeded target guidelines. In 2020, what was hated quickly became loved, an ideal environment for rebalancing.
Conclusion
Everything happened in 2020. It was a year of constant change. But it also reminded us what is truly important—family, friends, and community. We have never been more grateful for our clients. When things were scariest, you had the trust and confidence in us to stick to the plan. We know it wasn’t easy, so thank you.
We’d also like to thank the investment managers we use, the economists and analysts we read, and the local business leaders who helped us cope and make sense of the world while in lockdown.
We look forward to the upcoming year, like never before.