


CKBlog: The Market
Monday, March 16, 2020
The Most Common Question
by Steve Haberstroh, Partner
(Written hours after the S&P 500 Index dropped 11.98%.)
“Why don’t I just sell my stocks and wait until the dust settles?”
In a perfect world, we would have seen this coming, understood the extent of it, knew how long the selling would last, and perfectly timed our re-entry into the markets. But last I checked, as evidenced by the virus’ outbreak, we don’t live in a perfect world.
I know I know. Goldman Sachs just came out saying they expect the market will bottom 15% below today’s levels. The good folks at Goldman are bright, but if they are so good, why didn’t they tell us when the market was going to top?!
That aside, questions from friends and clients about getting out (or partially out) are valid and totally understandable. The recent market action has literally been INSANE! We’ve registered the second biggest one day sell-off in history and it was the second among the top five all-time worst in just the last five days!
So why not just get out and wait it out?
First, if you asked ten people what the “all clear” signal would be, you’d likely get 7-10 different answers. Is it the slowing of new diagnosis? Is it when there are more “recovered” than “deceased?” When we have a vaccine?
Or has the dust settled only once we know the recession is behind us? Or when the markets have recovered to a certain level? Which level? Do you see why this is hard?
To help address this conundrum, today, for our Instagram page, I took a deeper dive into corporate earnings during the Great Financial Crisis (GFC). More and more, I hear people comparing today to then—after all, we haven’t seen this much volatility since 2008. Nor have we realistically expected the economy to flat out stop since then.
As I dug into historical earnings, I tried to put myself back into the 2008 frame of mind. As if today wasn’t bad enough!
2008-2009
Let’s assume you weren’t one of the handful of folks who “called the crisis” beforehand. When would have been your “I’m out until the dust settles moment” in 2008? Would it have been the Lehman Brothers bankruptcy? The official declaration that the US was in recession? Or once S&P earnings bottomed and began to rise?
Let’s see when each of those occurred on the chart of the S&P 500 back in 2008-2009.
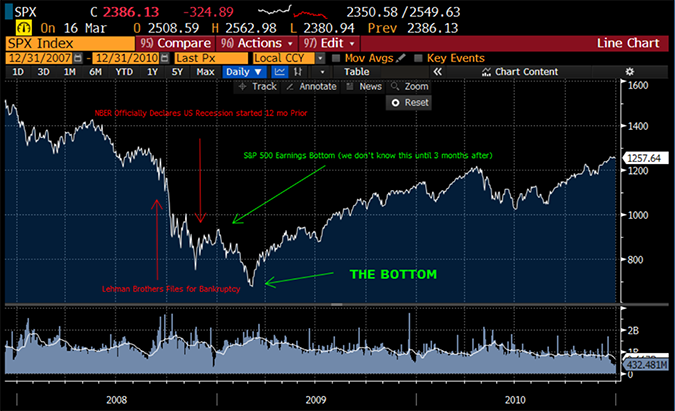
As you can see, each of those “I’m out” moments were deep into the sell-off. How deep?
By the time Lehman collapsed, the SPX was off 33%.
Once a recession was official declared, SPX had dropped more than 42%.
Selling at either of those times would have locked in substantial losses. The market had already dropped. Most of the bad news had been priced in. You’d be selling just when ... things began to bottom.
Does that sort of feel like now?
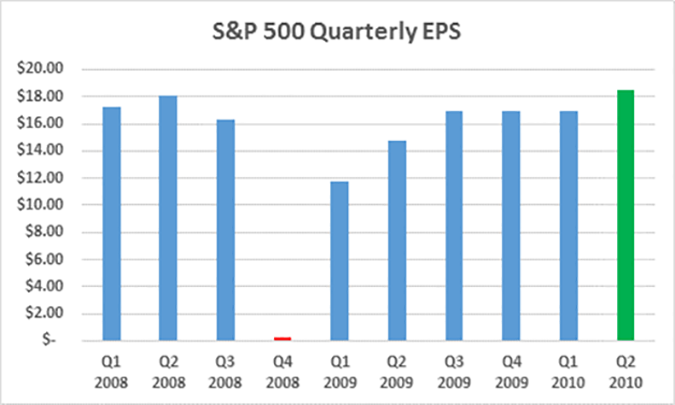
Earnings Bottom
You wouldn’t have known S&P earnings had bottomed until several quarters later, but imagine yourself in early 2009 when companies began to report Q4 2008 “earnings.” I remember this well. It was UGLY! The news was just awful. And while in aggregate, the S&P 500 companies reported positive earnings, it wasn’t by much. Q4 2008 is the red bar.
Investing can be so difficult. Precisely when it’s best to buy stocks is when it feels the absolute worst. But as you can see from the above, selling when things are worst is a great way to miss out on future returns.
Since Lehman went bankrupt (09-15-2008), the S&P 500 Index has returned 8.03% per year through today’s sell-off.
Since the US recession was officially declared (12-01-2008), the S&P 500 Index compounded at 12.30%. You’ve nearly tripled your money through today.
Today feels awful. Arguably the worst you’ve experienced as an investor. Does it feel like 2008?
Do you still want to sell?