


CKBlog: The Market
Wednesday, February 14, 2018
Is it Time to Break Up with the S&P?
by Steve Haberstroh, Partner

Many of you out there have committed nearly 100% of your investable assets to the S&P 500 index or have been contemplating doing just that. Given the recent correction (we officially hit a 10% sell-off in the index), on this Valentine’s Day, I ask “should you break up with the S&P?”
It’s been a great run. Last year, the S&P 500 index was up 21.82% and has been on a tear for years. If you bought a low-cost S&P 500 index exchange traded fund (ticker: SPY) on the market’s low during the financial crisis (March 9th, 2009), and held it until the end of 2017, you’d be up +371.67% for an annualized gain of +19.24% per year (including dividends)!
Until 2018, it had also been an uncharacteristically smooth ride. As our CIO pointed out in our 2017 Annual Review (2017 Market Review):
During 2017 the ascent of the equity markets was a steady grind upwards. This is great for buy and hold investors, but not great for active traders. The S&P 500 index has seen positive monthly gains for the last 14 months. The largest single day drop in the S&P 500 index in 2017 was -1.82% and the largest one day gain was 1.38%. You have to go back to 1964 to find a year in which there was a lower largest single day gain! Slow and steady certainly worked in 2017.
No wonder many investors have fallen in love with the Index. It’s been so attractive, even-keeled and gives out plenty of benefits (2% dividend yield ya sicko!). Investors couldn’t resist, committing $30.2 billion of their investable assets into the iShares S&P 500 Core ETF in 2017. Many were convinced they’d be with the S&P 500 forever.
Trouble in Paradise
But just like that, there was trouble in paradise. It’s as if the index left empty beer cans out or was asked to turn the football game down-all hell broke loose.
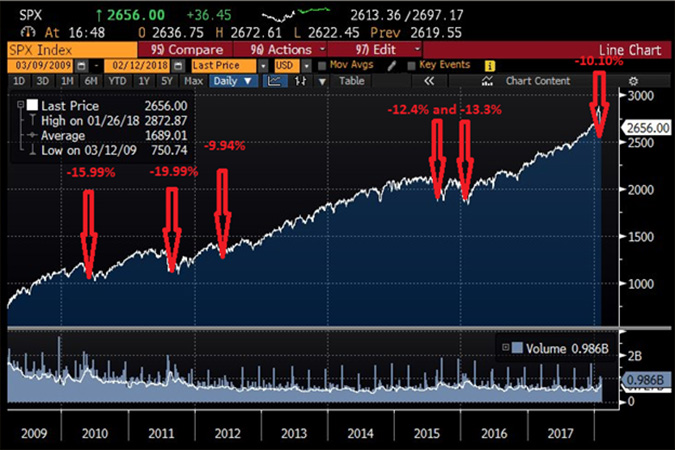
From its all-time high on January 26th, 2018, the S&P 500 index dropped by -10.10% in just nine trading days (through February 8th)! Investors were left reeling and calling their financial therapists! So much so, the websites of Fidelity, TD Ameritrade and Merrill Lynch crashed for a period of time on February 5th. (Our website, as well as our custodians’ websites, never went dark. Quite the opposite. At the market close on the 5th, we sent a note to clients reminding them of my cell phone number. We were on call!)
Recent trading activity has reminded us that being in bed with the S&P 500 doesn’t come without tumult. It’s important to note that I am not suggesting investors completely sell out of their S&P 500 index funds based on several trading days. I have, however, grown concerned that lured by strong recent returns, more and more investors have put all of their investable eggs into the S&P 500 basket. Perhaps many would be better suited in a more diversified, dare I say, polygamous portfolio?
It’s What’s Inside That Counts!
So should the S&P 500 index be your only soul mate? In order to answer this, we must first understand what constitutes the S&P 500 Index. “I know you say you love him, but do you even really know him?”
According to S&P Global, the S&P 500 Index “measures the performance of the large-cap segment of the market. Considered to be a proxy of the U.S. equity market, the index is composed of 500 constituent companies.” In layperson’s terms, it’s a basket of the 500 largest publicly traded companies in the US.
Each year, the Homecoming Committee meets to select prom King and Qu ... I mean, a group of analysts called the “S&P Index Committee” meet to determine which stocks make it into the index. They will consider things like market size (price of the stock multiplied by number of outstanding shares), liquidity (can investors buy and sell the stock easily), and industry grouping (analysts don’t want the entire index to be technology companies for instance). It’s a pretty scientific process.
The index is market value weighted, meaning as the value of a company’s stock increases faster than the rest of the companies in the index, it becomes a bigger part of the index. As these largest companies do well, so too should the performance of the index.
2017 was a prime example of this. The top four companies in the S&P 500 index, Apple, Microsoft, Amazon, and Facebook, now account for more than 10% of the overall index. They were all up huge in 2017. With Apple up +48.48%, Microsoft up +40.72%, Amazon up +55.96%, and Facebook up +53.38%, these four companies accounted for nearly 25% of the S&P 500 Index’s gain on the year. Imagine if your high school sweetheart, Johnny, was not only the star quarterback but he was the lead in the school play, recently got into Harvard, AND drives a brand new Tahoe! Sounds too good to be true or at least, to last.
Information Technology companies now make up 23.76% of the S&P 500 index (end of 2017). This is up from 15.27% of the index at the end of 2008, further depicting the relative strength and influence of tech companies in today’s market. Good for them but warning signs are flashing. No sector represented more than 20% of the index since Financials did it in 2006 at 22.27%. We all know how that ended ...
It’s important to highlight this because positive trends can reverse and it can be painful. If so-called “tech companies” fall out of favor, the index will likely suffer steep losses too. This is one of the principal risks of putting all of your investment eggs in the S&P 500 index basket.
To get under the covers and see a full list of all 500 companies, please visit: SPDR S&P 5000 ETF-SPY
‘Til Death Do Us Part?
Many investors have been piling into the index because they believe it is “safe”. We commonly hear, “well it’s performed so well so why would I own anything else?” It’s true that when most people ask “is it safe?”, what they really mean to say is “can I lose money?” The answer is, “Absolutely!” Earning 19% per year for almost nine years didn’t happen in a straight line. There’s no such thing as a free lunch.
The stellar run began after the index was down -36.81% in 2008. In fact, since the market low of March 9th, 2009 there have been 16 times where the S&P 500 index traded down more than 5% off its highs. These include drawdowns of -15.99% in 2010, -19.99% in 2011, -9.94% in 2012, -12.4% and -13.3% in 2015, and -12.71% in early 2016 (source: Bloomberg). Not to mention the latest sell-off.
If all you owned was the S&P 500 index, your portfolio would have ended the year down almost 40% in 2008. Would that have been acceptable? In the midst of these drawdowns, would you have held on? If you sold, when would you have bought back in?
If you cannot stomach the losses that come with the gains, maybe going “all-in” with the S&P 500 index isn’t for you. Most people don’t hate roller coasters, they hate when riding them makes them sick.
True, the honeymoon period has brought you so much joy in recent years. I encourage you however, to recall that a commitment to the index comes with losses too. And once a cheater, always a cheater!
Breakups are never easy. But if it means your financial health will be better served, consider playing the field. Going all in on the index may not be right for you. And in this case, you wouldn’t be lying by saying, “It’s not you, it’s me.”
If you’d like to learn more about how we build transparent, diversified, and lovable portfolios focused on our client’s specific needs, please reach out to me for a complimentary discussion. I can be reached at 203-682-7204 or .(JavaScript must be enabled to view this email address).
Happy Valentine’s Day.