CKBlog: The Market
Monday, July 25, 2022
2022 Semi-Annual Review
by The CastleKeep Team
At -19.97%, it was the worst start to the year though six months for the S&P 500 Index since 1970.
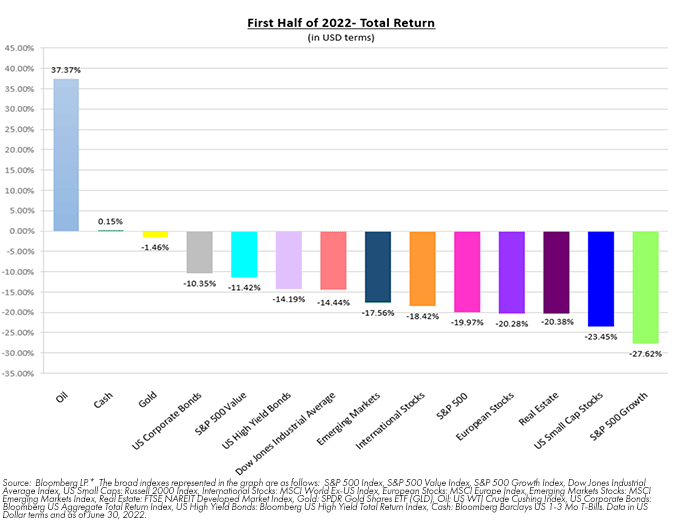
The Bloomberg US Aggregate Total Return Bond Index was created in 1976. It has never closed the year down more than 2.99% yet it is down 10.35% for the first half of the year.
If you owned a traditional portfolio consisting of 60% stocks and 40% bonds, using the S&P 500 Index and the Bloomberg US Aggregate Bond Index noted above, you were down 16.12%. And if you wanted to hide out in gold? It was down 1.46%. Cash may have been flat, but when you factor in inflation you lost 5% or more in purchasing power.
There were few places to hide in the first half of the year. Oil/Energy was one, defense stocks were another, as well as certain defensive stocks. However, oil/energy grossly underperformed the S&P 500 Index for the previous three years, so was underrepresented in most portfolios.
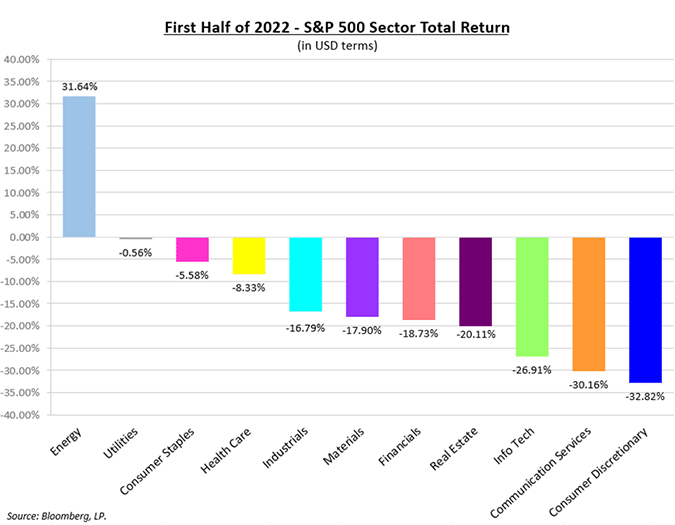
For most investors, the first half of 2022 is a period we would soon like to forget. Let’s take the opposite approach. Let’s dig into what happened and perhaps use the current environment as a constructive time to look into the future.
Speculation and Inflation
Much of the global markets’ sell-off can be attributed to two themes: speculation (or the bursting of it) and inflation. In retrospect, it’s clear that speculation was rampant in the years leading up to 2022. On the back of double-digit annual returns in the US stock market averages since the Great Financial Crisis and fueled by “free money” (Fed Funds rates at record lows and stimulus during and post COVID), investors—err speculators—could do no wrong leading up to this sell-off.
It’s clear (with the benefit of hindsight of course), after witnessing the rise of crypto-currencies, non-fungible tokens (NFTs), trading cards, “meme stocks,” unprofitable tech companies, special purpose acquisition companies (SPACs) and Tesla being worth more than all US publicly traded companies combined, that being prudent with your money became a finance faux pas. Imagine showing up to a cocktail party last year and offering up a hot stock tip in say ... The Coca-Cola Company. It was up 7.84% including dividends for the year through end of June while Bitcoin (as measured by the Bloomberg Galaxy Bitcoin Index) was down 58.80%.
So what caused the shift in sentiment? No one can be 100% sure, but inflation certainly had something to do with it—at least indirectly. Whether caused by supply shortages or the printing of trillions of stimulus dollars post COVID, inflation took hold. Whether it was the price of a house or a dozen eggs, price increases were all around us. In fact, from June 2021 to June 2022, the CPI increased by 9.1%, a level not seen in 40+ years.
There are two forms of inflation, aside from the typical ones referred to in the media (such as CPI above). One is reported inflation, the other is inflation psychology. The prices of the former move up and down based on supply and demand. The latter is probably what the policy makers are most concerned with. That is when the consumer buys a product today because they expect its price to rise in the future—even if they have no use for the product today. It creates excess demand today, pushing up prices immediately, but robs future sales. The longer it persists, the worse the final crash becomes. Having lived through this in Brazil during the 1980s, it is something we are keeping a watchful eye on.
The Fed
To combat inflation, Central Banks around the world began to increase their benchmark rates. In the US, the Fed has raised their benchmark rate by 1.75% so far this year. When savers earn more interest on their cash, and pay more in interest on their loans, folks begin to rethink how they spend and invest. Suddenly, an unprofitable company with no prospects of earnings for 5+ years isn’t as attractive as it was when interest rates were near zero. Nor is something called a “cryptocurrency” that pays no interest, pays no dividends, and has no credible intrinsic value. Homes also become less attractive as mortgage rates make financing more onerous. The sell-off across a variety of markets and assets has been painful, but it has also been “textbook” for those who carry PhDs in Economics.
In fact, by raising interest rates, the Federal Reserve’s objective is to cool off the economy. By most measures, except for that pesky inflation, they have been successful thus far. Will it continue?
At the time of writing this letter, the Fed has signaled another 75-basis-point hike in its end of July meeting. A hike of that magnitude has already been priced into the market. After this month, the Fed isn’t scheduled to meet again until September so rate hike talk may slow down until then (although an “emergency” inter-meeting rate decision is always possible).
Speaking of slowing down, while backward CPI readings have been running hot, recent indicators suggest inflation indeed may be slowing. Consider how far the following commodities have fallen from recent 2022 highs (all data as of July 15th, 2022):
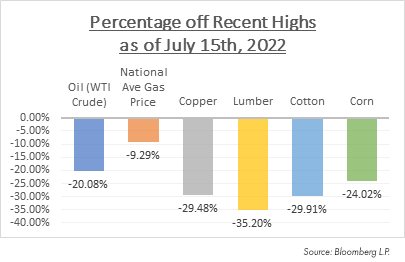
Dairy, eggs, and meat prices haven’t cooled as much. Nor has rent or housing prices (yet). However, note below that the percentage of price drops for listed homes has increased precipitously (courtesy of Redfin).
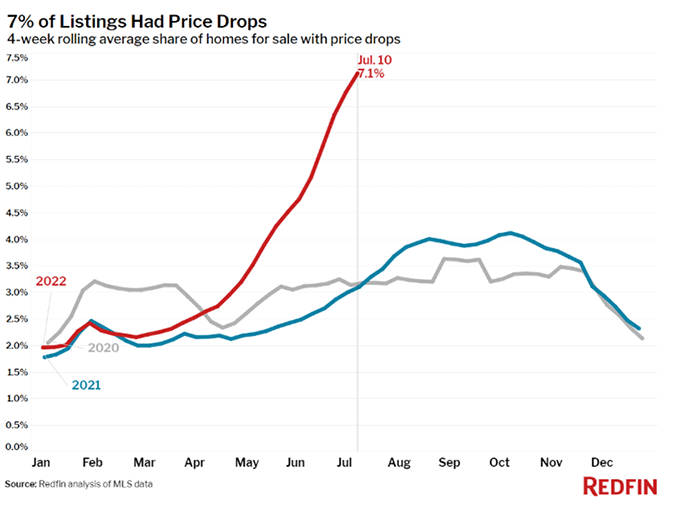
Some are calling for the worst of inflation being behind us. But if we’ve learned anything from the last several years, successfully predicting macro events is rare. It is reasonable to expect inflation may slow, but it likely is here to stay for some time. We do not recommend making drastic changes to your investments based on inflation predictions.
The R Word
If “inflation” was the most commonly used word in finance this year, “recession” has been a close second. You cannot read the local paper, scroll through Twitter or catch the nightly newscasts without coming across the “R” word. Just look at the Google Trends of folks looking up “recession” over the last six months. Interesting to note the popularity dropped in the latter half of June.
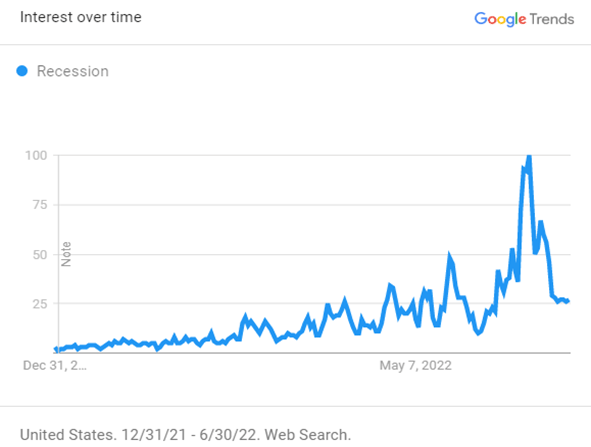
So are we in a recession? Are we headed for one? No one knows for sure. A recession is generally defined by at least two consecutive quarters of negative GDP growth. More technically, the National Bureau of Economic Research (NBER), the government body tasked with measuring and designating recessions, defines one as:
A recession is a significant decline in economic activity spread across the economy, lasting more than a few months, normally visible in real GDP, real income, employment, industrial production, and wholesale-retail sales. A recession begins just after the economy reaches a peak of activity and ends as the economy reaches its trough. Between trough and peak, the economy is in an expansion. Expansion is the normal state of the economy; most recessions are brief and they have been rare in recent decades.
US GDP contracted at an annual rate of 1.2% in the first quarter of 2022. So if the second quarter also contracts, most pundits will consider the US to be in a recession. But what does that mean for the stock market?
Looking Forward to Forward Looking
Recessions, by definition, are backward looking. We won’t know we are in a recession until after we are in one. But the stock market is forward looking. Investors buying a stock today are likely making a prediction about how the underlying business will perform in the future. So with the S&P 500 Index dropping by more than 20% from its highs this year, a reasonable amount of weakness, whether defined as a recession or not, has already been priced in.
In fact, there is record pessimism priced into today’s market. Consider the following chart from Bank of America, who surveyed 259 money managers between July 8 and July 15, with a collective $722 billion in assets under management. They have less overall equity exposure and more cash holdings today—equating to lower levels of risk than they had at the bottom of the Global Financial Crisis!
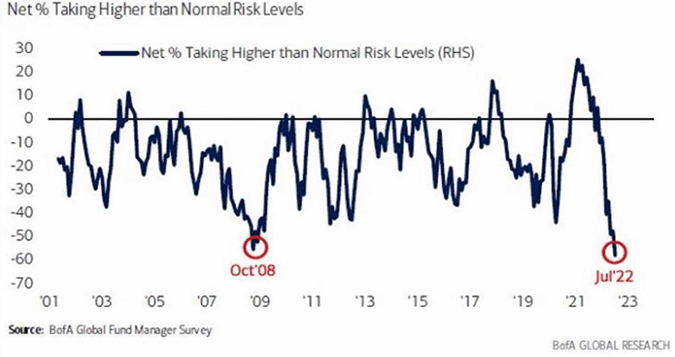
What happened to the S&P 500 Index after the drop in risk levels as indicated above in October 2008? It compounded at 12.86% per year from November 1, 2008 through June 30, 2022 resulting in a total return of 415.30%. Sounds like when fear is greatest, opportunities for long-term investors are plenty.
It turns out that consumers’ maximum pessimism about their finances might also be a reasonable buy signal. Consider the following graph from JP Morgan. It highlights the peaks and troughs of consumer sentiment then measures how the S&P 500 Index performed in the subsequent 12 months after each of those peak periods.
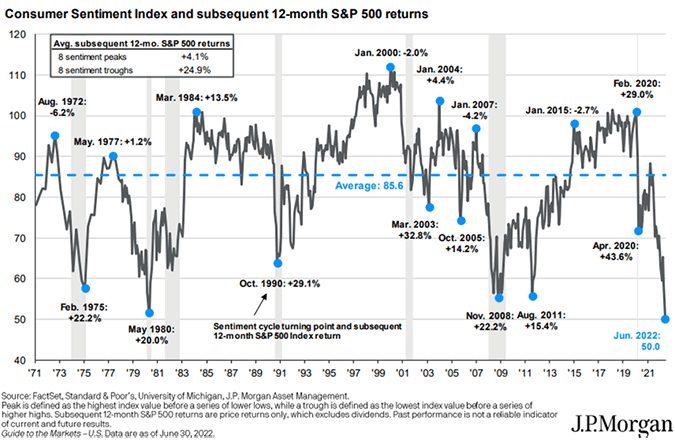
If you invested in the eight sentiment peaks, when consumers felt most confident, your 12-month return averaged 4.1%. If you had you the courage to invest at the eight sentiment troughs, when folks were at peak pessimism, your average 12-month return was 24.9%. Turns out, it’s better to invest when folks feel the worst. Or as Buffett has said, “Be fearful when others are greedy and greedy when others are fearful.”
Bear Market
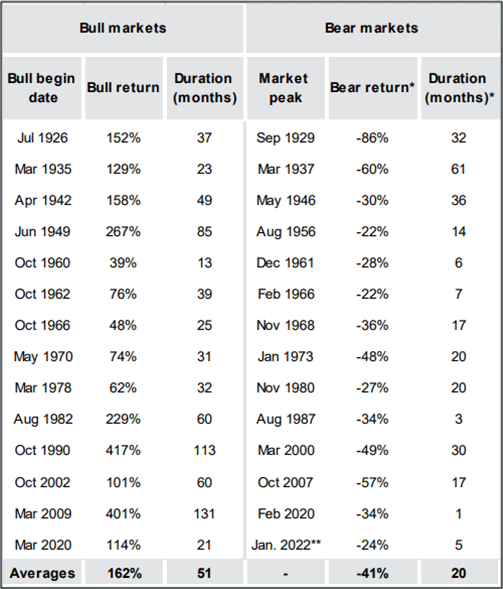 It’s no wonder why consumers feel so negative. 2022 brought us the first bear market since the Global Pandemic and the Global Financial Crisis before it. Asking anyone how they feel after a 20% drop in their investments will yield a pretty somber result. Inflation is high, and their stocks are lower. But during bear markets, should investors be more optimistic about the future? Yes.
As noted before, if you are a long-term investor, it’s better to put funds to work in the midst of dramatic sell-offs. It’s empirically true. Ask any seasoned investor if they wished they had put more money to work during the depths of 2020, the Global Financial Crisis of 2008-2009, the bursting of the Dot-Com bubble in 2001, or during Black Monday in 1987 where the market dropped by 22.6% in one day. They would all tell you the best advice was to invest more or hold on.
Go back to the Great Depression and the same is true. Just look at the Bull Market recoveries that occurred after Bear Markets in the chart by JP Morgan.
It pays to stay invested, even when you’re most pessimistic. No one can truly predict when the market will turn, but it usually happens when we least expect it.
Other Items of Note
- If interest rates continue to rise, bond prices will continue to drop. At some point, however, the yield will be attractive enough to run the risk of further rate hikes. For now, we prefer shorter duration bonds or instruments that can float with prevailing interest rates.
- Keep an eye on the US Dollar, which continues to strengthen versus most major currencies. This includes the Euro, which as of this writing is at its lowest point versus the US Dollar in 20 years. When the USD is strong, Americans and US multi-national corporations have greater spending power abroad. But for US multinational companies that have revenues outside of the US, a strong USD eats into their reported profits. US corporations have begun to lower 2022 earnings’ guidance, referencing the strong US Dollar.
- The stock market is very sensitive to housing starts. You will hear a lot about sticker shock based on the rapid rise of interest rates’ effect on mortgage payments. While it is a “shock” to see the 30-year mortgage rates double over the last 4-6 months, by historical standards a 6% mortgage is still reasonable (assuming long-term inflation averaging 3% per annum). Baby Boomers will recall mortgage rates as high as 15% or more. The housing sector may slow in the short term but there is still a lack of supply of available housing. Expect housing starts to pick up again to meet the demand of millennials entering the age of household formation.
- Technology stocks, today, are the largest component of the S&P 500 Index by far. Those mega-cap technology stocks were especially weak through the first six months of the year. Amazon, Meta Platforms (Facebook), Microsoft, Alphabet, Tesla, and Netflix were down 36.29%, 52.06%, 23.29%, 24.78%, 36.28% and 70.97%, respectively (including dividends). As a result, the equal weighted version of the S&P 500 Index outperformed the S&P 500 market-cap weighted index by roughly 2.5% over the same period.
- Value-oriented stocks fared better during the first half of year. Warren Buffett’s Berkshire Hathaway was down 9.26%, Exxon Mobil was up 42.96% and the S&P 500 Value Index was down 11.42% compared to the S&P 500 Index loss of 19.96%, all over the same period.
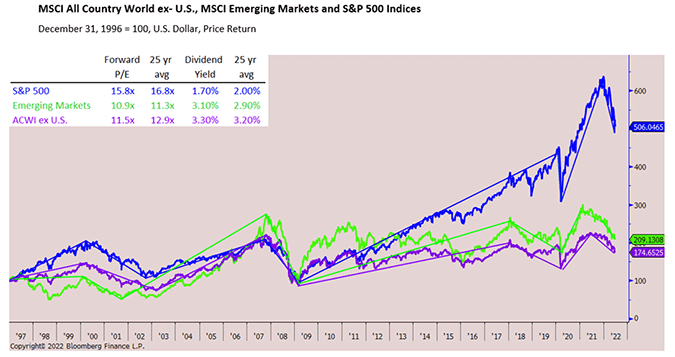
- Look abroad. Non-US stocks remain less expensive (as defined by price-to-earnings ratios and price-to-book ratios) and pay higher dividends than their US counterparts. If you’ve been following us in recent years, you’re probably familiar with the following graph illustrating why we believe it is a good idea to diversify abroad.
We started this letter by noting that this was the worst start to the year for stocks since 1970 and we are on pace for the worst calendar year returns for the bond market. That’s the bad news. The good news is that unless you were over-levered or took on too much risk, your portfolio likely remains intact. Successful investing requires your portfolio to remain invested during sell-offs so you can reap the rewards of market recoveries.
We’ve used this example before. If you had invested in the S&P 500 Index the day before 1987’s Black Monday when the market dropped by 22.6% in one trading session and held on through June 30, 2022, you would have experienced an annual return of 10.12%. If you had been lucky or savvy enough to have waited until the day after the 22.6% drop, your annual return would have only improved to 10.85%.
Time in the market is more powerful than timing the market.
Sincerely,
The CastleKeep Team
July 25, 2022
Here is the PDF version of our 2022_Semi-Annual_Review


