


CKBlog: The Market
Sunday, January 30, 2022
2021 Year in Review
by Steve Haberstroh, Partner
The bull market in risk assets continued in 2021, led by oil, US stocks, and real estate. In fact, of the below asset classes, only US corporate bonds, emerging market stocks and gold were down on the year.
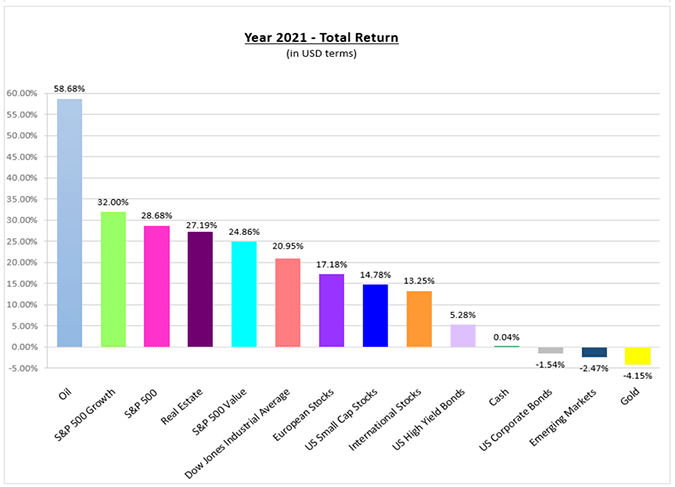
Source: Bloomberg LP.* The broad indexes represented in the graph are as follows: S&P 500 Index, S&P 500 Value Index, S&P 500 Growth Index, Dow Jones Industrial Average Index, US Small Caps: Russell 2000 Index, International Stocks: MSCI World Ex-US Index, European Stocks: MSCI Europe Index, Emerging Markets Stocks: MSCI Emerging Markets Index, Real Estate: FTSE NAREIT Developed Market Index, Gold: SPDR Gold Shares ETF (GLD), Oil: US WTI Crude Cushing Index, US Corporate Bonds: Bloomberg Barclays US Aggregate Total Return Index, US High Yield Bonds: Bloomberg Barclays US High Yield Total Return Index, Cash: Bloomberg Barclays US 1-3 Mo T-Bills. Data in US Dollar terms and as of December 31, 2021.
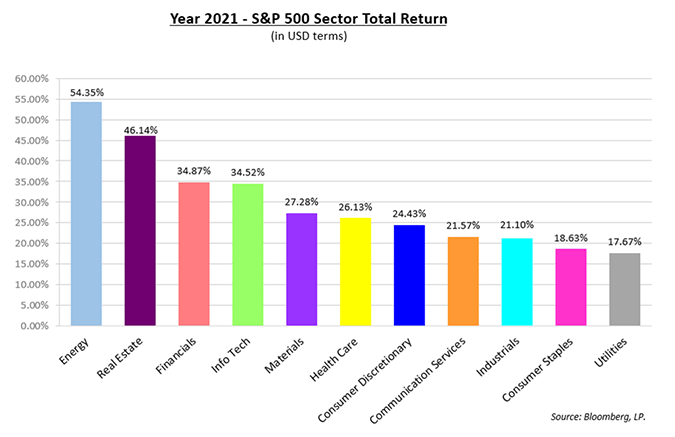
At the sector level, energy, real estate (principally REITS), financials, and information technology sectors outpaced the overall performance of the S&P 500 Index.
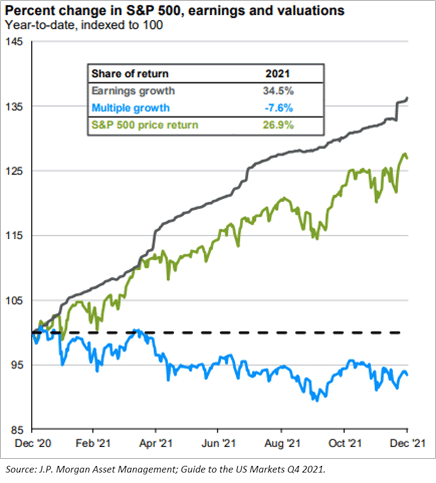
What drove the performance of the overall market? Stellar earnings growth. As the chart below from JP Morgan demonstrates, S&P 500 earnings increased +34.5% but the price of the index “only” grew +26.9%. Earnings grew more than the price of the index appreciated. Incredibly, after such a strong gain, stocks ended the year cheaper than when it began.
US Corporations performed extremely well coming out of the pandemic especially considering the second and third waves of Covid. With demand from the US consumer remaining strong, inflation began to creep into our everyday lives and the front page of most newspapers.
Inflation is now impossible for the Federal Reserve to ignore. If consensus is correct, interest rates will rise and usher in a new dynamic for investors. Let’s explore how we got here.
Interest Rates and Inflation
Global interest rates hit all-time lows in early 2020 when most central banks cut rates to support local economies and spur demand.
In the US, this meant that chartered banks could borrow money from the Federal Reserve at historically low rates (currently 0.0% to 0.25% per annum). Money centers and regional banks then passed these lower rates onto their customers. This is known as Quantitative Easing (QE).
The two principal effects of QE are:
- Demand for goods and services rise. With less of their money going to pay interest on debt, people tend to buy more vehicles, homes, products and equipment.
- Asset prices move higher. Cash sitting in bank accounts earns less interest thereby incentivizing investment into other asset classes. Why leave cash in your savings account earning 0.05% per year when you can own a bond that has a higher coupon, a stock that pays a higher dividend, real estate with greater income or invest in a local business that can grow and earn cash flow? During QE, folks are willing to take on more risk.
It wasn’t just the Federal Reserve that made moves to spur demand. Congress and state and local municipalities provided fiscal support in the form of stimulus checks, government sponsored loans, increased unemployment benefits, and higher minimum wages throughout 2020 and late into 2021.
The confluence of households paying less interest on debt, being flush with stimulus cash and higher wages has translated into the highest GDP growth since the early1980s and record corporate profits. It’s no wonder why the major stock market indexes closed at or near their all-time highs as 2021 came to a close.
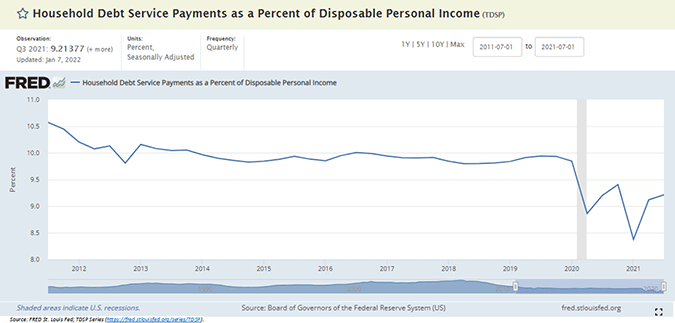
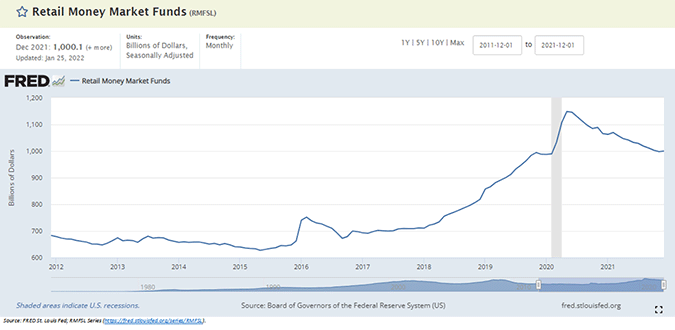
Can this level of economic strength continue? Only time will tell, but US households’ debt service as a percentage of their disposable income remains at multi-decade lows as depicted by the chart below.
Meanwhile, retail investors remain flush with cash. This dry powder is the fuel for future investments.
Inflation
If the demand for goods and services outpaces the supply of goods and services, prices will inevitably increase. When prices increase, the workforce will seek employment elsewhere if the wages at their current employer don’t keep up. Companies will have to increase wages to attract and or retain their employees. The result is inflation and it is upon us.
Not only was demand for goods strong in 2021, but supplies were constrained due to the pandemic. Supply shortages meant folks were forced to pay more for the goods that they really wanted or needed. US inflation, as measured by CPI, hit 7% in December 2021, the highest reading in decades. The graph below depicts the year-over-year growth of the US Consumer Price Index (CPI) for the last 10 years.
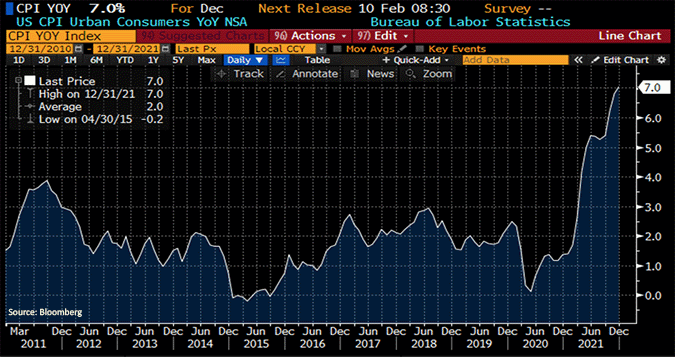
The inflation inflection point occurred in June of 2020. It was precisely then that market participants began focusing more on sectors that historically have performed well in inflationary environments.
Inflation Hedge
Our family lived in Brazil during the late 1980s when Charlie led Chase Manhattan Bank’s lending operations in commodity financing. At the time, the country was experiencing hyper-inflation of 3% ... per day! If we had $100 dollars on Friday it was worth $90 by Monday.
We’d note that most professional investors today have not lived through (let alone have invested through) a prolonged inflationary period nor have the first-hand experience of hyper-inflation. We certainly view inflation as a risk to overall markets. Textbooks are informative but there’s nothing like the real thing!
Combining our experience and understanding of inflation with what historical data tells us, stocks and hard assets (real estate, commodities, art) tend to perform better than cash and fixed income.
Sectors such as banks, energy companies, companies that increase dividends, real estate operators, land owners, and companies that have the ability to pass on price increases to customers tend to weather the inflationary storm well. If the above characteristics make you think of value oriented stocks, you’d be correct.
Circularity of the Central Bank
How will global central banks react should inflation persist? It turns out that the single most powerful tool to combat inflation is—you guessed it—the Federal Funds rate. Just as lower rates should spur the economy, higher rates should conversely cool it off, bringing prices down with it.
The US Federal Reserve has recently signaled multiple rate increases in 2022 so as we embark on the new year, a rising rate environment will remain a common theme. Investors have taken note.
In fact for the first two weeks of 2022, as of January 15 of this year, sectors and companies that typically fare well in inflationary and rising rate environments have positive returns:
Banks (ticker KBE): +10.72%
Energy (ticker XLE): +16.23%
Berkshire Hathaway (ticker BRK/A): +7.70%
While sectors and companies that typically are punished during inflationary and rising rate periods are negative on the year:
Technology (ticker XLK): -4.66%
Software (ticker IGV): -10.21%
NASDAQ 100 (ticker QQQ): -4.48%
Most investors focus on stocks, but if rates continue to rise, traditional, longer duration fixed coupon bonds should also suffer in the short-term whereas bonds with interest rates that can float higher with prevailing rates offer protection. True to form, the iShares 20+ Year Treasury Bond ETF (ticker TLT) has dropped by -4.11% while the iShares Floating Rate Bond ETF (ticker FLOT) is virtually flat at -0.06% this year through January 15th.
Using the above as real-time, real-world examples, we would continue to avoid longer duration bonds and believe the environment for equities, in general, remains more constructive than their fixed income counterparts. But buyer beware, not all equities are created equal. The most expensive and the least profitable companies should be avoided (despite how well they have performed in recent years). We prefer companies with a strong balance sheet and positive cash flow that are led by experienced management teams.
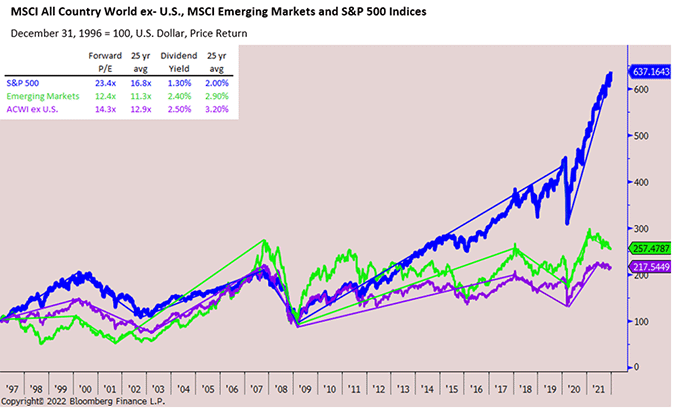
Look abroad, too. Not only for diversification, but stocks are cheaper and yield more abroad as depicted in the below chart.
Expectations for 2022
Last year we initiated or maintained several tactical moves for our discretionary clients including:
- Exposure to bank stocks;
- Exposure to energy via pipeline stocks;
- Exposure to emerging market stocks within our international stock allocation;
- Avoided longer dated bonds within our fixed income allocation;
- Avoided higher priced, unprofitable technology stocks.
All but the emerging market exposure has worked out well thus far (although it wasn’t until very recently that high priced technology stocks began to aggressively sell-off).
If market dynamics remain as they are today, our conviction behind these tactical moves will not change. But if the last several years has taught us anything, it’s to expect change.
Our Business
Our business remains strong, thanks to our clients, service providers, and the CastleKeep team, most notably Lauren, our VP of Investments, who celebrated her 10th year with the firm! We are lucky to have her.
We’d also like to welcome each of the new clients that joined CastleKeep in 2021. A special thank you to those clients who have referred us new relationships. Referrals are the ultimate compliment.
The highlight of our work is when we get to “meet” with clients. While the definition of “meeting” has changed over the last couple of years, we look forward to connecting in person, phone, or video chat with each of you.
Thank you and best wishes for a healthy and prosperous 2022.
Sincerely,
Steve Haberstroh and the CastleKeep Team
January 30, 2022
Here is the PDF version of our 2021 Year in Review