CKBlog: The Market
Wednesday, July 28, 2021
2021 Semi-Annual Review: Hang On
by The CastleKeep Team
We ended our 2020 semi-annual review with the following note:
Broken record aside, we’d like to end the analytic portion of this review by reminding you that it pays to hold on. So, thank you for doing just that, especially during the most volatile and perhaps scariest six months some of us can remember.
Your investment journey can be painful in the short term (as it has been this year), but whether you hold bonds, stocks or a 50-50 mix, your results get better the longer you hold. You can’t win the game if you quit halfway through.
We are quick to admit we have no ability to consistently predict what markets will do in the short run. But our experience and research give us the confidence to urge clients to remain invested, even during the darkest of times. This strategy has paid off over time, and the first half of 2021 has been no different.
What has been different is what has led the market so far in 2021. First, take a look at how major asset classes have performed through June 30th, 2021. Then take a look at the S&P 500 sector returns in the for the same period:
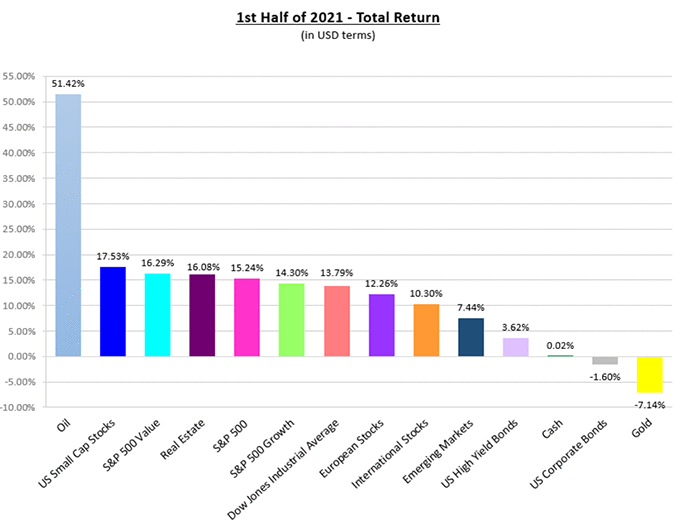
Source: Bloomberg LP.* The broad indexes represented in the graph are as follows: S&P 500 Index, S&P 500 Value Index, S&P 500 Growth Index, Dow Jones Industrial Average Index, US Small Caps: Russell 2000 Index, International Stocks: MSCI World Ex-US Index, European Stocks: MSCI Europe Index, Emerging Markets Stocks: MSCI Emerging Markets Index, Real Estate: FTSE NAREIT Developed Market Index, Gold: SPDR Gold Shares ETF (GLD), Oil: US WTI Crude Cushing Index, US Corporate Bonds: Bloomberg Barclays US Aggregate Total Return Index, US High Yield Bonds: Bloomberg Barclays US High Yield Total Return Index, Cash: Bloomberg Barclays US 1-3 Mo T-Bills. Data in US Dollar terms and as of June 30, 2021.
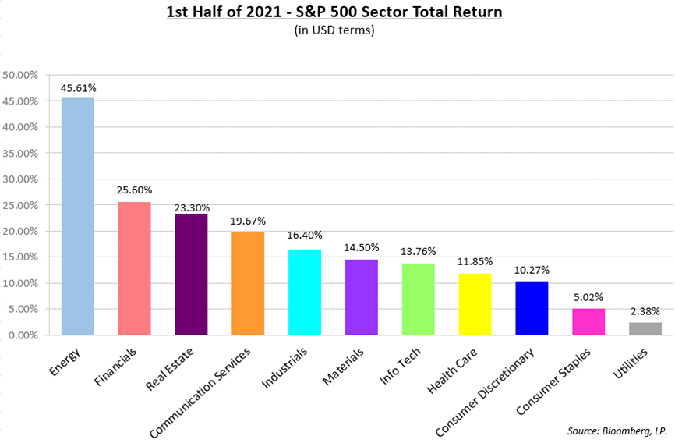
Energy, financials and real estate have had the strongest performance in 2021. A stark contrast to what we’ve experienced over the last 10+ years where investors paid up for technology and growth—a constant theme of our letters over the same period.
Market Shift
Is this a long-term shift in the market? What’s driving the change? As we’ve written about before, investors are more willing to buy expensive, unprofitable companies when interest rates are very low. Rates in the US (and most developed countries) have traded near all-time lows since the Financial Crisis. They moved even lower in 2020 when the Federal Reserve used monetary policy to stimulate the economy. Check out the yield of the US Gov’t 10-Year index since 2008:
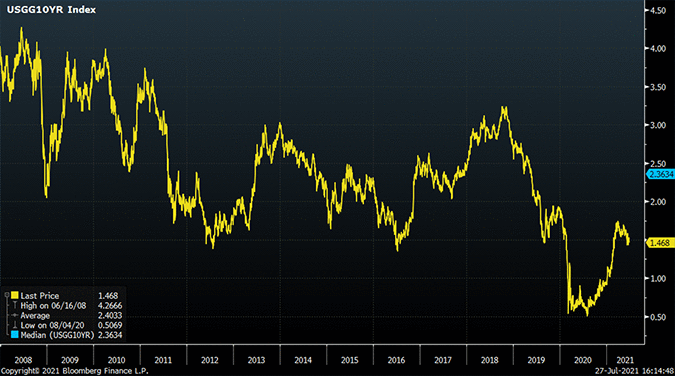
Zoom in to 2021 and you can see an uptick in yields. What caused rates to move higher since late 2020 (albeit from a very low base)? The prospect of inflation.
Inflation
Everything seems to cost more. It’s been the talk of both Wall Street and Main Street. On Wall Street, it is represented by higher valuations, in large part caused by historically low interest rates. On Main Street, it has hit us at the grocery store and in housing costs, caused by the end(?) of the pandemic and resultant consumer demand.
If inflation is real and is here to stay, then we’d expect the Federal Reserve to gradually increase the fed funds rate. History tells us higher rates tend to be constructive for so-called value stocks. Recent history tells us the same.
Starting in late 2020 when interest rates began to move higher, investors started shifting away from high flying names and paid more attention to the more profitable, cash-flow generating companies that tend to screen as value stocks. “Value Investing” is synonymous with Warren Buffett so it is no surprise that this shift to value has buoyed shares of Berkshire Hathaway. Below is the one-year graph ending June 30, 2021 comparing Berkshire Hathaway to the S&P 500 Index, S&P 500 Growth Index, and the S&P 500 Value Index:
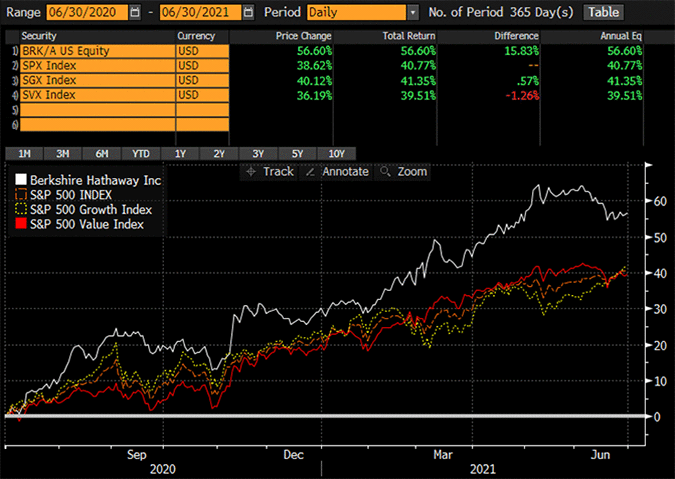
Source: Bloomberg, LP
What’s Next?
For long-term investors, we continue to prefer equities over fixed income especially in this environment of low interest rates (although prudent asset allocation will call for some exposure to bonds). Recall that the prices of bonds have an inverse relationship with interest rates. As rates move higher, bond prices move lower. We will find bonds more attractive as yields approach or exceed inflation expectations.
Certain areas of the US equity market appear overvalued. We would argue that start-up companies with no earnings, no prospect of earnings, trading at high multiples of sales per share fit that category. So do the so-called meme (fad) stocks which trade up on social media. One could also make the case that mega growth companies probably are at the high end of their historical valuations. The law of large numbers means that it is increasingly difficult for those equities to grow at historical rates and therefore justify their current stock prices. However, just like the late 1990s internet boom and bust, it is very difficult to know when those bubbles (meme stocks) will burst.
On the other hand, we continue to find bank stocks attractive based on total return. The bank regulators have approved banks to increase dividends and stock repurchases, so that we believe the total combined return to shareholders will approach 8 to 10% pa. Likewise, despite bad publicity in the oil and gas sector, for discretionary clients we have maintained a conservative exposure to oil and gas pipelines. Until renewables play a larger role in the energy complex, there continues to be high demand for natural gas and oil, especially in the high population density Northeast US.
We also continue to find non-US stocks attractive. As we’ve written about for several years now, when you look abroad, you find lower valuations, higher dividend yields, and an asset class that has been overlooked for more than a decade. We’ve been publishing the following chart for several years now:
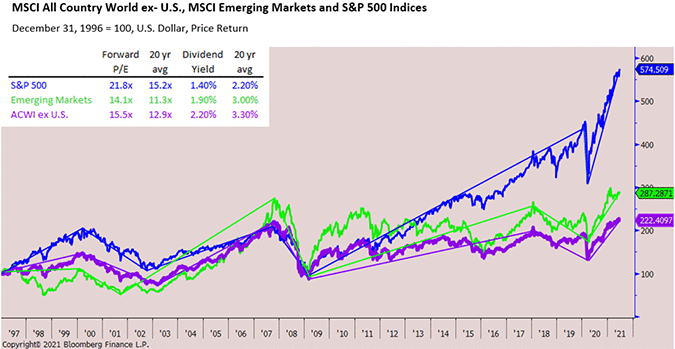
The characteristics we mentioned above make us feel comfortable having exposures outside of the US.
Holding On
We started this review reminding our readers of the benefits of holding on. There will be periods where market action (and the pundits commenting on TV about it) will give you the urge to go to cash. With the S&P 500 Index (and most global equity indices) at or near all-time highs, it’s not uncommon for investors to feel anxious about allocating large percentages of their portfolios to stocks. Exposure to equites doesn’t always equate to taking on undue risk. In fact, we’d argue it’s riskier to miss out on the wealth that equites have delivered to those who have remained invested. How many times over the last 120 years have investors been tempted to sell?
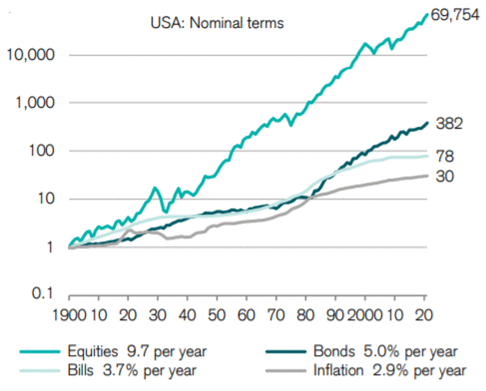
Source: Credit Suisse Global Investment Returns Yearbook, 2021 Summary Edition.
Hang on. It is worth the ride.
Sincerely,
The CastleKeep Team
July 28, 2021
Here is the PDF version of our 2021 Semi-Annual Review: Hang On


