CKBlog: Strategies
Wednesday, October 31, 2018
Timing versus Time Frame
by Steve Haberstroh, Partner
Timing: the ability to select the precise moment for doing something with optimum effect
Timing: the ability to select the precise moment for doing something with optimum effect
They say “timing is everything.” Sure, when investing, getting the timing right when buying and selling a stock can make a huge difference in actual performance. But as we’ve previously written, timing the market is nearly impossible. It requires you to be right twice. You could have been a genius to sell out of stocks in 2007 prior to the financial crisis, but if you never “got back in,” were you really any good at market timing?
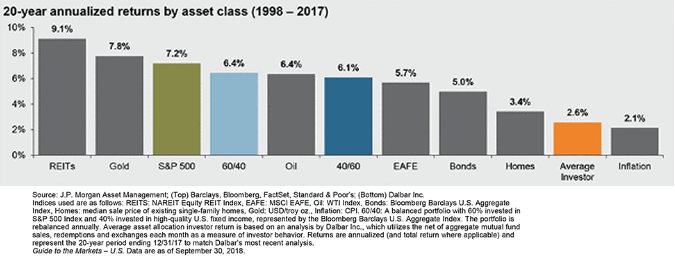
Ample research exists demonstrating just how bad humans are at market timing. The chart below from JP Morgan makes it clear. In aggregate, the average investor could have picked any single asset class and would have enjoyed better results than their own trading. Why? Bad timing and excessive commissions (usually a result of frequent trades). At least they beat inflation ... .

So, if trying to time the market is futile (and usually destructive), what should you focus your energy on? Getting your time frame right.
Time frame: a period of time especially with respect to some action or project
We spend a lot of time thinking about and speaking to clients about time frame. It is critically important to us and to our clients’ financial success for two reasons. First, it allows us to build the proper portfolios given particular objectives. Second, in times of stress and volatility, focusing on a portfolio’s time frame objective can help prevent a client from acting on emotions.
Time Frames can Frame Proper Portfolio Construction
“Do I go big into stocks? Should I buy emerging markets? Bonds are safe, should I just invest in those?”
These are typical questions we hear from new clients. And to help provide a valuable answer, we start with understanding the time frame of their objective.
For example, if a client has a pool of funds earmarked for a home purchase in less than one year, they should have significant exposure to money market funds or short-term government bonds. Did you know that Three Month US Treasury Bills currently sport an annualized yield north of 2%? Why risk losses in stocks for something as important as a home purchase?
On the flipside, a client might “feel safe” in bonds but with a retirement objective in 20 years, over-allocating to bonds may mean a lower quality of life when they finally retire. A long-term objective calls for large exposures to stocks even if there is a reasonable chance of suffering losses in the near term. Remember, timing is nearly impossible. In order to outperform the toll inflation will take on retirement dollars over time, an investor must allocate a significant portion of his or her assets to stocks—and stick with it.
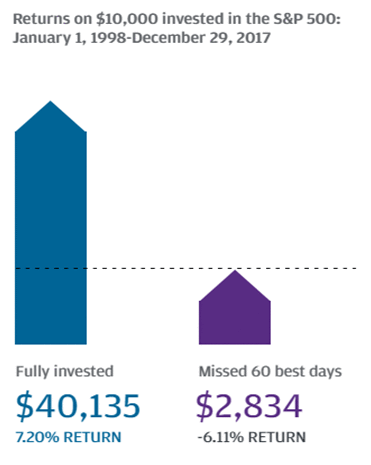
Look at the difference in results if you missed the S&P 500 Index’s 60 best days over a 20-year period.
Our job, therefore, is to identify the right game for our clients to play, then do everything in our power to keep them in that game. It all starts with understanding time frame.
Blood in the Streets
For thousands of years, humans have been taught to run from danger in the real world. But in the investing world, we are supposed to run towards danger. As Warren Buffett tells us, “The time to buy is when there’s blood in the streets.” The problem is, when most investors see blood on Wall Street, their instinct is to sell out and sit in cash—even if their investment game plan calls for a 20-year horizon.
Consider the swings we’ve experienced just this year. Through January 26th, the S&P 500 Index (SPX) was up +7.55%. A short-term-minded investor might have been tempted to go “all in.” But in the next nine trading days, the SPX dropped -10.10%! Should you have sold and gone to cash? Nope. The market traded steadily higher by another +10.08% through September 30th to be up +10.56% on the year. All clear signal? Nope! From October 3rd to October 29th, the S&P 500 Index dropped nearly -10%!
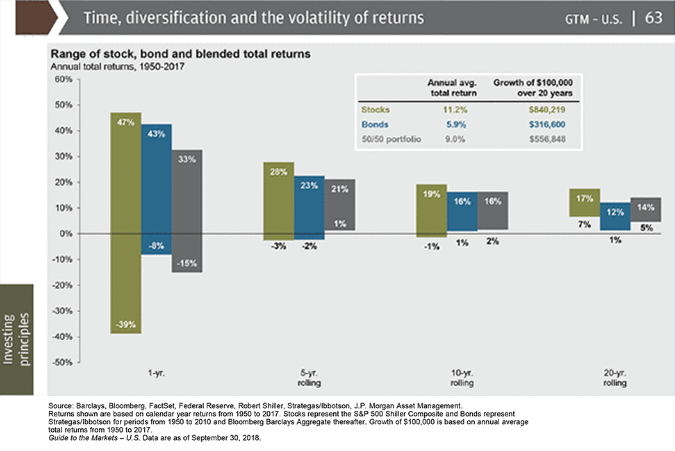
Your best defense against short-term swings is to take the longer view. Consider the chart below, again from JP Morgan. Going back to 1950, one-year returns for stocks (SPX) ranged from positive +47% to a loss of -39% (2008). If you hold on for five years, the worst rolling five-year return was -3%. Hold on for ten years, your worst rolling ten-year return was almost break-even at a loss of -1%. A twenty-year holding period meant your worst result was positive +7%! It pays to stay in the game.

What the chart demonstrates is that short term swings can be very painful when investing in stocks. But if all you do is hold on, there has never been a 20-year period where your stock portfolio, as represented by the S&P 500 Shiller Composite, was down in real terms.
So during a market sell-off, instead of trying to time the market, reorient your perspective back to time frame. It will be worth your time.


